
RESEARCH ARTICLE
Leila Vaalavirta1,*, Nigora Rasulova 2, Kaarina Partanen 3, Timo Joensuu1, Kalevi Kairemo 2
1Departments of Medical Oncology and Radiotherapy, 2Molecular Radiotherapy & Nuclear Medicine, 3Radiology
Docrates Cancer Center, Saukonpaadenranta 2, FI-00180 Helsinki, Finland
Table of Contents
Abstract
Purpose: It is known that the estrogen receptor (ER) status of a tumor is an important prognostic and predictive indicator in breast cancer. Women with ER-positive breast tumors have a better prognosis than women with ER-negative tumors in terms of responsiveness to anti-estrogen treatment. 16α-[18F]-Fluoro-17β-estradiol (18F-FES) has proven to be a promising tracer for in vivo imaging studies of the ER status of primary and metastatic breast cancer. Consequently, at our Institution positron emission tomography/computed tomography (PET/CT) using estradiol, labelled with fluorine-18, is an important diagnostic tool to be used in hormone-dependent breast cancer.
Materials and Methods: To date, we have applied this 18F-FES-PET/CT method in 18 breast cancer patient examinations. We have evaluated by means of 18F-FES, the location of the disease, preoperatively in one patient and in the remaining 17 patients we used 18F-FES-PET/CT for the follow-up/planning of hormonal therapy and/or radiation therapy and chemotherapy.
Results: The patient group has so far revealed 148 metastatic lesions in 18F-FES-PET/CT imaging. Lesions were located: 1 lesion (0.67%) in primary tumor in the unoperated patient, 15 lesions (10.1%) in lymph nodes, 2 lesions (1.35%) in lungs and 130 lesions (87.8%) in bones. Mean SUVmax in the primary tumor was 1.5; in lymph nodes 6.24±2.5 (2.4-8.8) and in bones 8.6±4.7 (1.5-22.4). In lungs, there were only 2 lesions – SUVmax 7.5 and 3.5, respectively. In 5 out of 18 patients (27.7%) the therapy was changed after 18F-FES-PET/CT study. There was a good correlation between SUVmax of lesions on 18F-FES-PET/CT and tumor marker CEA as well as number of lesions and the CEA level.
Conclusion: On the basis of this preliminary work, we know that tumor imaging with 18F-FES PET/CT is useful in the determination of ER status and prognosis of hormonal therapy for breast cancer patients. We suggest potential scenarios where this functional metabolic imaging might be considered in clinical use for guiding ER-positive breast cancer treatment in problematic individual cases.
Keywords: breast cancer, positron emission tomography, estrogen receptor, estradiol, fluoroestradiol
1. Introduction
In women, breast cancer is the most common malignancy. Two-thirds of breast carcinomas express estrogen receptors (ERs). Estrogens act primarily by regulating gene expression and ERs are found in the cell nucleus of the female reproductive tract. They can also be located in the breast, pituitary, hypothalamus, bone, liver amongst other tissues. Furthermore, estrogen receptors (ERs) can also be found in men. Estrogens are lipophilic and they enter the cell passively by diffusion, through the cellular membrane and bind to estrogen receptors which are present in the nucleus [1].
Estrogens are involved in the growth and development of both normal and cancerous breast tissues. The activity of estrogens in breast tissue is mediated by ligand-dependent transcription factors called estrogen receptors (ER). The hormonal dependence of breast carcinomas, as indicated by the results of estrogen receptor assays, is usually predictive of the possible outcome that a breast cancer patient will respond to such hormonal therapy as is anti-estrogen treatment. Higher ER expression has been found to be associated with an increased likelihood of response to hormonal therapy. About 75% of breast cancers are ER-positive at diagnosis [1,2].
ER expression of cancer tissue is usually measured at the time of primary diagnosis. In metastatic breast cancer, ER expression can be heterogeneous meaning that cells at one site may be ER+, while cells at other sites may be ER-. In addition, ER expression may change over time. Recurrent breast cancer may have low ER expression, even though the original primary tumor was ER+ [1,2]. It is supposed that there are differences in the estrogen-receptor content of primary and metastatic lesions in 20-25% of breast cancer patients [2,3,4].
When compared with an in vitro assay of tumor biopsy material, PET imaging has the advantage of being able to measure in vivo tumor behaviour, characterize the entire tumor burden and capture the heterogeneity of the tumor phenotype [5]. Inhibition by anti-estrogen (tamoxifen) of 18F-FES uptake in tissues with estrogen–receptor content has previously been shown in an animal model [6].
In the study of McGuire et al. 1991, they demonstrated that 18F-FES uptake in metastatic lesions, before and after anti-estrogen therapy, indicated definite reduction of 18F-FES uptake in nearly all lesions [7]. 18F-FES uptake correlated well with immunohistochemistry measures of ER expression in breast cancer [8,9].
Functional imaging of the ER using 18F-FES-PET/CT has been shown to be a predictive tool in determining response to hormone therapy and PET imaging can be used to measure the pharmacodynamic effect of ER-directed hormone therapy [10]. In the study of Peterson et al. 2011, they showed that 18F-FES and [18F]-FDG uptake varied greatly both within and amongst patients. 18F-FES-PET/CT demonstrated a conspicuous number of patients with the heterogeneity of ER expression [11].
Several serum tumor markers have been proposed to indicate the presence and future behavior of breast cancer. Moreover, tumor marker measurement can be used to help make treatment decisions, especially in patients without axillary node involvement [7]. Unfortunately, the sensitivity of serum tumor markers is usually considered low, particularly in patients’ with early-stage tumors. Subsequently, their clinical usefulness is still controversial [12,13].
Estimation of the serum level of carcinoembryonic antigen (CEA) and cancer antigen 15-3 (CA15.3) may, however, be an important diagnostic and prognostic indicator and therefore a good predictor for relapse in some breast cancer patients.
16α-[18F]-Fluoro-17β-estradiol (18F-FES) is an estrogen receptor-specific PET tracer. The main objective of the present analysis was to retrospectively evaluate the value of 18F-FES-PET/CT in 18 breast cancer patients, who were in a clinical dilemma whether to continue with hormonal therapy or to switch to other treatment modalities. This retrospective analysis was performed, according to the principles of the Declaration of Helsinki and our patient database was approved by the Finnish authority for the protection of privacy and personal data.
2. Materials and methods
Patients: The study population consisted of 18 non-pregnant women who had been diagnosed with breast cancer. This group of patients had a history of histologically proven ER-receptor positive breast cancer and had indication for 18F-FES-PET/CT examination when they presented a clinical dilemma for their treating physician.
The patients in the study were 38-78 years old (mean 60.4±10.3 years). A total of 17 patients were operated 1 month – 9 years before the examination (mean 3.39±2.4 years) and one patient was operated a few days after 18F-FES-PET/CT examination. Patients had T stage 1-4, N1, M 0-1 breast cancer. The hormone receptor and HER2 status of all 18 patients are presented in Table 1.
No Age Initial T Initial N Initial M Expression of Receptors Expression of Progesterone Expression of Her-2
1 74 4 3 1 +++ +++ negative
2 77 2 1 0 +++ 0 negative
3 65 1 0 0 +++/0 +++/0 negative
4 57 1 1 0 ++++ ++ +
5 56 1 0 0 + + negative
6 78 1 0 0 + 0 negative
7 56 3 3 0 ++++ ++++ negative
8 50 1 1 0 +++ ++ negative
9 68 3 2 1 + 0 negative
10 52 2 1 0 ++++ + +
11 45 3 2 0 + ++ +
12 53 2 1 0 +++ + negative
13 38 2 1 0 +++ +++ negative
14 64 2 2 0 +++/0 0/0 ++/++
15 50 2 1 0 +++ 0 negative
16 46 1 0 0 +++ +++ +++
17 70 2 1 0 + + ++
18 45 2 1 0 ++ ++ negative
Table 1. Receptor status of the patient group.
Six patients started hormonal therapy 16.9±15.4 months, (min 2 weeks, max 48 months) and five patients stopped hormonal therapy 10±3.3 months before 18F-FES-PET/CT examination. The hormonal treatment used by the patients before applying 18F-FES-PET/CT is described in more detail in Table 2.
Clinical and biochemical monitoring of disease activity was completed for all patients, according to routine practice. For some of the patients [18F]FDG PET/CT and bone scanning had been performed recently to evaluate the extent of their malignant disease; three patients had a follow up 18F-FES-PET/CT control scanning.
Imaging protocol
18F-FES-PET/CT examination was done using a Siemens Biograph PET Scanner, combined with low-dose CT. The mean injected activity dose of [18F]-fluoroestradiol ranged from 167-409 MBq (mean 280 MBq +51.8 MBq). Whole body imaging was performed from the calvarium to the mid-thighs at 50+20 min (range 27-95 min), using 3 min per bed position and 4 hour fasting in order to decrease biliary uptake. The tracer was produced by MAP Medical Technologies (Tikkakoski, Finland) and the tracer production method has been described in publication by Knott et al. 2011[14]. Lesions were considered abnormal when focal tracer accumulation was greater than the background activity.
1) Diagnosis of malignant lymph nodes on 18F-FES-PET images were based on visual assessment; if focal increased, 18F-FES uptake corresponded with the CT findings. Lymph nodes were considered malignant if confirmed histopathologically.
2) Lymph nodes were considered benign if they were less than 10 mm on the CT scan and did not produce an abnormal 18F-FES uptake.
3) Interpretation of bone lesions (benign or malignant), depended on the anatomical localization and the presence/absence of 18F-FES uptake when compared with the resultant findings of whole body bone scans.
Statistical analysis
The acquired results are expressed as the mean + SEM for each index. For calculating correlation between tumor markers (CEA, CA 15.3) and PET findings (SUVmax and number of metabolically active lesions); Spearman rank correlation coefficient and simple linear regression for building the curves were used. To estimate possible statistical differences between groups with non-Gaussian distribution the Mann-Whitney U-test, with estimation of Z score, p- and U-values was used.
2 3 5 7 9 12 14 18
FES PET/CT Positive findings FES PET/CT Negative findings
No. of the patient on/off which when months No. of the patient on/off which when months
1 on Fulvestrant started 3 4
on Tamoxifen started 3
off Fulvestrant stopped 3 6 off Anastrozole stopped 12
no hormonal therapy 8 no hormonal therapy
off Fulvestrant stopped 9 10 no hormonal therapy
no hormonal therapy 11 on Tamoxifen started 0.5
no hormonal therapy 13 no hormonal therapy
on Letrozole started 12 15 on Letrozole started 12
on Exemestane started 48 16 no hormonal therapy
off Fulvestrant stopped 12 17 off Tamoxifen stopped 12
Table 2. Hormonal treatment of the patient groups showing positive and negative FES PET/CT findings.
3. Results
The total number of patients with positive and negative 18F-FES-PET/CT findings was 9 (50%). Amongst the patients with positive findings, three patients started to receive hormonal therapy such as fulvestrant, letrozole and exemestane at 3, 26 and 48 months prior to examination. Three of the patients discontinued hormonal therapy (all were receiving fulvestrant) 3, 9 and 12 months prior to examination. Three of the patients were not receiving anti-hormonal therapy.
In a group with negative 18F-FES-PET/CT findings, three patients were receiving anti-hormonal therapy, two were on tamoxifen starting 0.5 and 3 months prior to examination, one was receiving letrozole starting 12 months prior to examination. Three patients were not receiving anti-hormonal therapy. One patient with bilateral breast cancer had a positive lesion in one breast and no uptake in the other. Histologically this patient had ER receptors in the tumor on 18F-FES positive side and no ER-receptors in tumor on the other side. Representative images of this patient are shown in Figure 1.
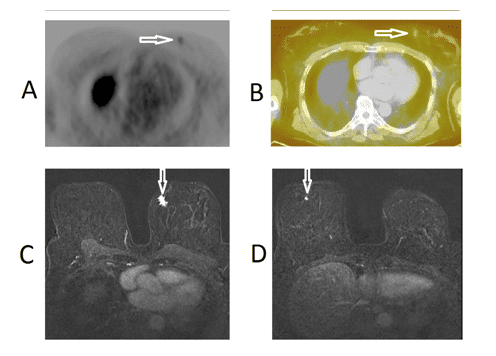
Figure 1.18F-FES-PET/CT images of patient No.3, a 65-year-old-female with breast cancer; T1N0M0 who had a grade 2 ductal breast cancer in the left breast (receptors ER+++, PR-, HER2-). This patient had another negative receptor cancer in the right breast. An axial PET-image (upper panel on the left, Fig. 1A) and a fused 18F-FES-PET/CT image (upper panel on the right, Fig. 1B) demonstrate a weak uptake in the small tumor of the left breast; whereas, there is no uptake in the right breast. Thus preoperatively, the left breast cancer was judged to be ER-positive and right breast cancer ER-negative: this was also the outcome from the histopathology of the bilateral surgery performed on the following day. Preoperative MRI images of the same patient with bilateral breast cancer demonstrate a 15 mm tumor in the left breast, (lower panel on the left, Fig. 1C) and a 6 mm tumor in the right breast, (lower panel on the right, Fig. 1D). The malignant tumors are marked with arrows.
In 9 patients, a total of 148 lesions were found. Lesions were located: 1 lesion (0.67%) in primary tumor in the unoperated patient, 15 lesions (10.1%) in lymph nodes, 2 lesions (1.35%) in lungs and 130 lesions (87.8%) in bones. Mean SUVmax in the primary tumor was 1.5; in lymph nodes 6.24±2.5 (2.4-8.8) and in bones 8.6±4.7 (1.5-22.4). In lungs, there were only 2 lesions – SUVmax 7.5 and 3.5 respectively. Images of 18F-FES-PET/CT found lung metastases in one patient, as shown in Figure 2.
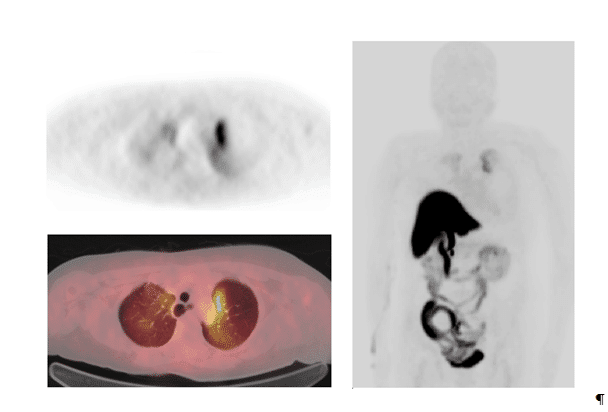
Figure 2.18F-FES-PET/CT images of patient No.3, a 65-year-old-female with breast cancer; T2N1M0 who had a grade 2 ductal breast cancer in the left breast (receptors ER+++, PR+++, HER2-); this cancer was diagnosed five years earlier. She developed lymph node metastases 4 years later and had already received radiation therapy, chemotherapy and hormonal therapy. In the 18F-FES-PET/CT study bilateral lung metastases were found. An axial PET-image (upper panel on the left) and a fused 18F-FES-PET/CT image (lower panel on the left), demonstrate a strong uptake in the left lung and a moderate uptake in the right lung. The maximum intensity projection (MIP-image) demonstrates the 3D-activity distribution in the apical parts of the lungs (right panel). The bowel uptake reflects normal distribution and is due to hepatobiliary clearance of the radiolabelled conjugated steroid metabolites (radiometabolites).
There was a correlation between SUVmax and CEA level (R=0.41), as well as between number of metabolically active lesions and CEA(R=0.60), but no correlation between PET/CT findings and CA 15-3 level. Results of 18F-FES-PET/CT findings and tumor marker levels are presented in detail in Table 3.
FES PET/CT positive findings FES PET/CT negative findings
No. of patient SUV max number of lesions CEA* CA15.3* Location No. of patient CEA** CA15.3**
1 1.5 1 22 61 bones 4 6.6 18
2 17.7 26 15.8 58 bones 6 1.8 18
3 1.5 1 2.5 25 breast 8 1 9
5 10.4 31 91.3 258.7 bones 10 1 13
7 5 6 1.3 22 lymph nodes 11 1.7 17
9 14 26 60 71 bones 13 1.3 14
12 6.4 35 25.6 60 bones 5 11.2 27
14 8.6 18 6 31 lymph nodes and bones 16 1 23
18 1.8 4 16 753 lungs and bones 17 4.1 45
Table 3. Summary of FES PET/CT findings and tumor markers used.
• CEA* – CEA**: The Z-Score is -2.53. The p-value is 0.008. The result is significant at p≤ 0.05. The U-value is 44. The critical value of U at p≤ 0.05 is 59. Therefore, the result is significant at p≤ 0.05.
• CA15.3* – CA15.3**: The Z-Score is 2.40. The p-value is 0.015. The result is significant at p≤ 0.05. The U-value is 15. The critical value of U at p≤ 0.05 is 20. Therefore, the result is significant at p≤ 0.05.
There was a statistically significant difference of the serum CEA and CA15.3 levels in the groups of positive and negative 18F-FES-PET/CT findings: p-values 0.008 and 0.015 respectively, as shown in Figure 3.
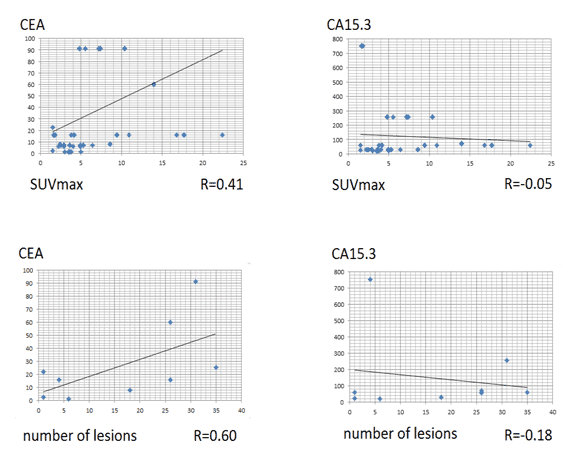
Figure 3. Correlation between PET/CT findings and tumor markers used.
• There was a correlation between SUVmax and CEA level and no correlation between SUVmax and CA15.3 level.
• There was a moderate correlation between number of lesions and CEA level and no correlation between number of lesions and CA15.3 level.
In 5 out of 18 patients (27.7%) the therapy was changed after 18F-FES-PET/CT study. Patients who had true negative findings in the 18F-FES-PET/CT study and had negative HER2- status were recommended to receive chemotherapy, according to the protocol used in treatment of triple negative breast cancer and they received at least a partial and/or long-lasting response from chemotherapy. Images of one of these patients, whose ER-positive disease became fully ER- negative after 18F-FES-PET/CT, is shown in Figure 4.
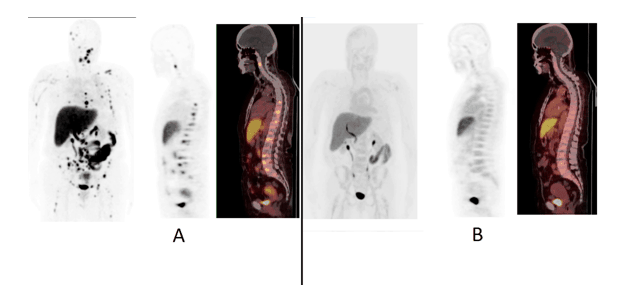
Figure 4. Two consecutive 18F-FES-PET studies of patient No.2, a 71-year-old-female with; T2N1M1 grade 2 breast cancer in the right breast (receptors ER+++, PR-, HER2-) was diagnosed three years earlier. She had developed skeletal metastases in the space of two years and had received radiation therapy, chemotherapy and hormonal therapy. In the first 18F-FES-PET study, multiple skeletal metastases were found, as seen in the maximum intensity projection (MIP-image (Fig. 4A, left panel), sagittal PET image (Fig. 4A, middle panel) and sagittal fusion PET/CT image (Fig. 4A, right panel). In the second 18F-FES-PET study 8 months later, these multiple ER-positive skeletal metastases had disappeared as seen in the MIP-projection (Fig. 4B, left panel), sagittal PET image (Fig. 4B, middle panel ) and sagittal fusion PET/CT image (Fig. 4B, right panel). This patient clearly demonstrated that a strongly ER-positive disease can become fully ER-negative.
One patient with an ER-positive primary tumor had multiple positive lesions in the lymph nodes, lungs and bones; as well as multiple negative lesions in the liver, which on biopsy was confirmed as metastatic but without ER receptors. Images of this patient are shown in Figure 5.
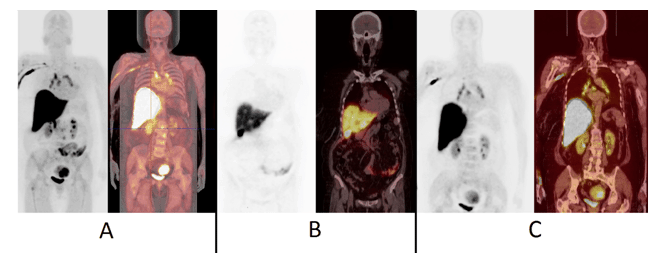
Figure 5.18F-FES-PET images of patient No.14, a 64-year-old-female with T2N2M0 infiltrative ductal breast cancer in the left breast (receptors ER+++, PR-, HER2++), had been diagnosed six years earlier. She developed liver metastases after four years and had received radiation therapy, chemotherapy and hormonal therapy. In the 18F-FES-PET study, multiple metastases were found in the vertebral column, the supraclavicular and mediastinal lymph nodes, as seen in the maximum intensity projection (MIP-image) (Fig. 5A, left panel) and fusion PET/CT- MIP image, (Fig. 5A, right panel). This patient also exhibited multiple liver metastases, which were visualized as defects on the coronal PET image (Fig. 5B, left panel) and coronal fusion PET/CT image (Fig. 5B, right panel). These metastases were ER-negative, based on US-guided liver tissue sampling and immunohistochemistry. Steroid metabolism occurs in the liver and radiometabolites are excreted into the biliary system and therefore the gall bladder is visualized. The mediastinal lymph node disease is seen on coronal PET-image (Fig. 5C, left panel) and coronal fusion PET-CT-image (Fig. 5C, right panel). These images (Fig. 5C) show that some urinary clearance may also occur and thus the kidneys and the urinary bladder are visualized. In this patient also uterine myomas can be seen (Fig. 5A and Fig. 5C). This patient had simultaneously both strongly ER-positive and fully ER-negative disease.
4. Discussion
We have shown at our Institution that metastatic lesions from breast carcinoma can be detected by PET as foci of increased uptake of radiolabeled FES. Hence, we have demonstrated that 18F-FES-PET/CT can be used to detect the presence of ER-positive metastases. It can not however be used to exclude metastases in general due to the heterogeneity of cancer tissue and the presence of ER-negative metastases.
Consequently, as shown in the images, normal organ uptake is present in the liver and sometimes in the urinary bladder. The physiological uptake in the liver is due to metabolization exceeding the uptake as shown in most ER-positive metastases [15]. We did observe focal ‘cold’ lesions in one patient. The cold appearance can be explained by focal loss of ER expression.
In early dosimetry studies, critical organs were the liver, gallbladder and urinary bladder (Peterson et al. 2008). Sometimes, the intestines are visualized in the latter images due to biliary clearance. This may happen even if patients have fasted. Subsequently, as a result of this biliary clearance and steroid hormone metabolism, the ER- and PR-targets (ligands) have similar distribution. These tracers are always highly lipophilic and therefore hepatobiliary clearance occurs. In an in vivo setting, this may be a disadvantage for evaluating ER-status of liver metastases.
The presence of estrogen analogs (e.g. tamoxifen) can block tumor 18F-FES uptake. In previous studies by Kruchten et al. there was a discussion about the false negative findings of 18F-FES-PET/CT and it was ascertained that premenopausal women were more likely to have these results [15].
It was recommended that a withdrawal time of 5 weeks was required in patients taking the estrogen analog treatment, which has a long half-life. For patients treated with fulvestrant, a drug with a longer half-life of 40 days, the treatment plan exceeded five weeks.
18F-FES-PET/CT has shown that estrogen-receptor binding capacity changes after intervention with hormonal drugs. Factors other than estrogen-receptor expression, including menopausal status and concomitant therapies which can affect tumor FES uptake, must be taken into account [16].
In our Institution, we did not have a strict protocol for withdrawal of these drugs and this might have had an effect on the results. Patients who were on hormonal therapy at the time of 18F-FES-PET/CT scanning showed positive results with 18F-FES-PET/CT; but we suggest that these findings would have been more intense if there had been a standard recommended withdrawal of hormonal therapy for all of the patients.
In our opinion, the true negative patients were the ones who had the most benefit from the 18F-FES-PET/CT study. It was possible to change the treatment plan from hormonal therapy to chemotherapy earlier than usual. In this group of patients, as there disease state was manageable, this may be the reason why their response was very good and long lasting with the chemotherapy regimen (capecitabine and docetaxel). These drugs are usually applied in the triple negative breast cancer treatment.
In this patient population consisting of nine patients, lesions were found in the skeleton, lymph nodes and lungs in 148 locations. The remaining 9 patients, with an active previously confirmed ER+ disease, were investigated but did not reveal any findings.
There was a correlation between SUVmax and CEA level (R= 0.41) as well as between number of metabolically active lesions and CEA. There was no correlation between PET findings and CA 15-3 level. This CA 15-3 level is derived from the proteolytic shedding of the extracellular domain of mucin1 (MUC1) glycoprotein. It has been reported that a luminal subtype of breast cancer shows higher expression in MUC genes and a positive relationship between MUC1 expression.
In their study Kos et al. demonstrated that in metastatic breast cancer patients there are differences between the breast cancer subgroups in terms of tumor marker levels. Tumor marker elevation was lower in the triple negative group, as compared to the luminal group [17].
In the study of Gemignani et al. it was demonstrated that there was a significant correlation between 18F-FES-PET/CT SUVmax and tumor size (p=0.0015) but not with ductal histology, grade, HER2-neu overexpression, PgR, estradiol, body mass index or lean body mass index [18].
5. Conclusion
Further studies are necessary to clarify the influence of different hormonal therapies on 18F-FES uptake for the treatment of metastatic breast cancer lesions and the patient’s response to therapy. 18F-FES-PET/CT could be used to evaluate the response of ER-positive breast cancer to hormonal therapy. Hormonal receptor status of breast cancer tissue can change due to the heterogeneity of cancer tissue. Some patients can have ER-positive and ER-negative metastases simultaneously. The ER-status influences the outcome of ER+ breast cancer patients and 18F-FES-PET/CT is an extraordinary new molecular imaging tool for this purpose.
Conflict of interest
The authors confirm that this article content has no conflict of interest.
References
Key References: 1, 7, 8, 10, 11, 14, 15, 16,18
- Linden H, Stekhova S, Link J et al. Quantitative fluoroestradiol positron emission tomography imaging predicts response to endocrine treatment in breast cancer. J Clin Oncol. 2006; 24: 2793-2799. [CrossRef] [PubMed Abstract]
- Butler J, Trezona T, Vargas H et al. Value of measuring hormone receptor levels of regional metastatic carcinoma of the breast. Arch Surg. 1989; 124: 1131-1136. [CrossRef]
- Manegold C, Klinga K, Krempien B et al. Iliac crest needle biopsy as a method for determining estrogen receptors in bone metastases from breast cancer. Oncology. 1989; 46: 31-34. [CrossRef] [PubMed Abstract]
- Campbell F, Blamey R, Elston C et al. Quantitative oestradiol receptor values in primary breast cancer and response of metastases to ensocrine therapy. Lancet. 1981; 2: 1317-1319. [CrossRef] [PubMed Abstract]
- Mankoff D, Link J, Linden H et al. Tumor receptor imaging. J Nucl Med. 2008; 49: 149S-163S. [CrossRef] [PubMed Abstract]
- Welch M, Mathias C, Brodack J et al. Tamoxifen therapy and in vivo determination of estrogen receptor concentration with 18-F-16α-fluoroestradiol-17β(FES). J Nucl Med. 1989; 30: 910.
- McGuire AH, Dehdashti F, Siegel B et al. Positron tomographic assessment of 16 alpha-(18F)fluoroestradiol (FES) in patients with estrogen receptor positive (ER+) breast cancer. J Nucl Med. 1991; 32: 1526-1531. [PubMed Abstract]
- Peterson L, Mankoff D, Lawton T et al. Quantitative imaging of estrogen receptor expression in breast cancer with PET and 18 F-fluoroestradiol. J Nucl Med. 2008; 49: 367-374. [Cross Ref] [PubMed Abstract]
- McGuire W, Tandon A, Allred D et al. Prognosis and treatment decisions in patients with breast cancer without axillary node involvement. Cancer. 1992; 70 (S1): 1775-1781. [CrossRef]
- Currin E, Linden HM and Mankoff DA. Predictive Breast Cancer Endocrine Responsiveness Using Molecular Imaging. Curr Breast Cancer Rep. 2011; 3: 205-211. [CrossRef] [PubMed Abstract]
- Peterson L, Kurland B, Link J et al. Factors influencing the uptake of 18F-fluoroestradiol in patients with estrogen receptor positive breast cancer. Nucl Med Biol. 2011; 38: 969-978. [CrossRef] [PubMed Abstract]
- Lumachi F, Brandes AA, Ermani M, Bruno G and Boccagni P. Sensitivity of serum tumor markers CEA and CA 15-3 in breast cancer recurrences and correlation with different prognostic factors. Anticancer Res. 2000; 20: 4751-4756.
- Gion M, Barioli P, Mione R et al. Tumor markers in breast cancer follow-up: a potentially useful parameter still awaiting definitive assessment. Ann Oncol. 1995; 6(S2): S31-S35. [CrossRef]
- Knott K, Grätz D, Hübner S et al. Simplified and automatic one-pot synthesis of 16a-[18F]fluoroestradiol without high-performance liquid chromatography purification. J Label Comp and Radiopharm. 2011; 54: 749–753. [Reference Source]
- van Kruchten M, Glaudemans A, de Vries E et al. PET Imaging of Estrogen Receptors as a Diagnostic Tool for Breast Cancer Patients Presenting with a Clinical Dilemma. J Nucl Med. 2012; 53: 182-190. [CrossRef] [PubMed Abstract]
- van Kruchten M, de Vries E, Glaudemans A et al. PET imaging of oestrogen receptors in patients with breast cancer. Lancet Oncol. 2013; 14: 465-475. [Reference Source]
- Kos T, Aksoy S, Sendur MA et al. Variations in tumor marker levels in metastatic breast cancer patients according to tumor subtypes. J BUON. 2013; 18: 608-613. [PubMed Abstract]
- Gemignani M, Patil S, Seshan V et al. Feasibility and predictability of perioperative PET and estrogen receptor ligand in patients with invasive breast cancer. J Nucl Med. 2013; 54: 1697-1702. [CrossRef] [PubMed Abstract]
Article information
Corresponding authors: Leila Vaalavirta.
Copyright: © 2014 Vaalavirta L, et al. This is an open-access article distributed under the terms of the Creative Commons Attribution License, which permits unrestricted use, distribution, and reproduction in any medium, provided the original author and source are cited.
How to cite: Vaalavirta L, Rasulova N, Partanen K, Joensuu T, Kairemo K. [18F]-Estradiol PET/CT imaging in breast cancer patients. J. Diagn. Imaging Ther. 2014;1(1):59-72 (https://dx.doi.org/10.17229/jdit.2014-1007-004).
Article history: Received 20 September 2014; Revised 06 October 2014; Accepted 07 October 2014; Published online 07 October 2014.
Archive link: JDIT-2014-1007-004

You Are Here: Home »
Tags: Breast Cancer, Positron Emission Tomography