REVIEW ARTICLE
Massimiliano Godani1,*, Francesca Canavese1, Massimo Del Sette1, Uwe Walter2
1Neurology Unit, Civic Hospital, Viale Italia 197, 19122 La Spezia, Italy
2Department of Neurology, University of Rostock, Rostock, Germany
Abstract
Over the past 20 years, transcranial B-mode sonography (TCS) of brain parenchyma is being increasingly used as a diagnostic tool in movement disorders. The most widely recognised finding for movement disorders has been an increase in echogenicity of the substantia nigra, an area of the midbrain that is affected in idiopathic Parkinson’s disease (IPD). This finding has enabled a reliable diagnosis of IPD with high predictive values. Other sonographic features – such as hypoechogenicity of the brainstem raphe and hyperechogenicity of the lentiform nucleus – might help to increase the differential diagnosis of IPD and other movement disorders. In comparison with other neuroimaging modalities such as magnetic resonance imaging (MRI) and computed tomography (CT), TCS can currently be performed with portable machines and has the advantages of non-invasiveness with high resistance to movement artefacts. In distinct brain disorders, TCS detects abnormalities that cannot be visualized – or can only be visualized with significant effort – with other imaging methods. This present update summarizes the current methodological standards and defines the assessment of diagnostically relevant deep brain structures such as substantia nigra, brainstem raphe, basal ganglia and ventricles for differential diagnosis of IPD and other movement disorders. Finally, we provide detailed information about the advantages and limitations of this novel neuroimaging method.
Keywords: transcranial sonography; Parkinson’s disease; atypical parkinsonian syndromes; secondary parkinsonian syndromes
Introduction
The diagnosis of idiopathic Parkinson’s disease (IPD) and other movement disorders such as atypical parkinsonian syndromes (aPS) and secondary parkinsonian syndromes (sPS), is based on clinical criteria [1,2]. These diseases differ considerably in their prognosis and treatment options; in addiction postmortem studies showed that IPD-specific pathologic features predate the onset of diagnostic clinical features by many years [3,4]. Therefore an early correct diagnosis is of critical importance. However, the distinction between the different parkinsonian disorders – purely on clinical grounds may be difficult, especially in the early course of the disease [5,6].
Several sophisticated neuroimaging methods, such as cranial computed tomography (CCT), magnetic resonance imaging (MRI), single photon emission computed tomography (SPECT) and positron emission tomography (PET), are widely used to discriminate between IPD and ET or other forms of parkinsonism (aPS and sPS). However, the sensitivity and specificity of these techniques are not sufficiently high [7–9].
Specifically, SPECT scans are most widely used in routine clinical practice to diagnose IPD. Nevertheless, a substantial fraction of patients with early IPD have normal scans [9]. Recently the advent of hybrid SPECT/CT imaging has increased the diagnostic value of this modality [10]. FDG-PET reliably discriminates with high specificity between distinct aPS subgroups like MSA, PSP and CBD [11,12]. Nonetheless, the broad application of this imaging method for all patients, even those in the early stages of the disease, is limited by availability, costs and the consequent risks of administering radioactive tracers [13].
Consequently, the search for a cheaper, more reliable and patient-friendly technique to diagnose IPD and to differentiate between the range of parkinsonian disorders has thus continued over the past decade. Transcranial B-mode sonography (TCS) of the substantia nigra (SN) has emerged as a promising tool in this regard.
TCS was initially developed for evaluating cerebrovascular disorders [14]. Since the mid-1990s, however, TCS has allowed the visualization of the main brain parenchymal structures and lesions [15,16]. More recently, the use of TCS has been extended to the diagnosis of movement disorders such as IPD [17,18], dystonia [19], Huntington’s disease [20], Wilson’s disease [21] and spinocerebellar ataxia [22,23]. Therefore, it is further demonstrated that this technique can help in the differentiation between IPD and aPS or sPS with high sensitivity and specificity [24–26].
An increased echogenicity of the substantia nigra is detected with high sensitivity and specificity [27] in more than 90% of patients with IPD [17,18,25,28]; whereas normal substantia nigra echogenicity in combination with hyperechogenicity of the lentiform nucleus (LN) is commonly seen in patients with aPS, including MSA and PSP [25,26,29]. The hypoechogenicity of the Raphe nuclei (RN) is related to depression in patients with or without parkinsonism [30,31].
The increased echo-intensity of the SN is found in about 9% of healthy individuals. This finding was associated with vulnerability of the nigrostriatal system and therefore may be useful to identify a potential subgroup of population who are at risk in developing the clinical illness. Their identification would open a window for neuroprotective intervention [32,33].
Technical aspects
TCS is commonly available and rapidly performed, inexpensive, radiation-free and non-invasive method which can be administered at the bedside. The improvements in transducer technologies and advances in signal processing have refined the image resolution [34,35], to the point that TCS systems available at present can produce an image of higher resolution greater than those obtained by an MRI scan [36]. TCS is executed by pressing the ultrasound transducer on the temporal bone, at the periuricular site on the orbitomeatal line.
The visible brain structures and ‘sonographic landmarks’ have been described in detail for different planes and angulations of the transducer [30,37]. Typically, a low-frequency phased array transducer is used with a frequency range of 1-4 MHz being focused at a depth of 6-8 cm.
Ideally, the depth range is chosen in order to allow for visualization of the contralateral side of the skull [38]. If the temporal bone window is appropriate (80-90% of the individuals) the scanning of this axial plane generates a 2-dimensional image of the brainstem, basal ganglia and ventricles [30]. The mesencephalon becomes visible as a butterfly-shaped structure which is surrounded by the echogenic basal cisterns (Figure 1).
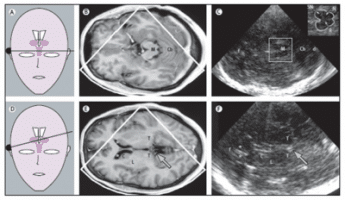
Figure 1. Corresponding MRI and TCS images of scanning planes typically investigated with TCS in movement disorders. (A) Schematic illustration of the axial scanning plane at the level of the midbrain. (B) MRI of axial section at midbrain level. (C) TCS image corresponding to (B). The square box denotes the area to be magnified for assessment of midbrain structures as shown in the image in the top right corner. (D) Schematic illustration of the axial scanning plane at the level of the thalamus. (E) MRI of axial section at the level of the thalamus. (F) TCS image corresponding to (E): Both MRI and TCS images in (E) and (F) were obtained within the same, slightly oblique level. The arrows in (E) and (F) indicate the pineal gland that can be regularly shown on TCS as a ‘sonographic landmark’ of high echogenicity owing to calcification. C = head of caudate nucleus; Cb = cerebellum; d = dorsal; f = frontal; L = lenticular nucleus; M = mesencephalon; N = red nucleus; R = raphe; T = thalamus; *Frontal horn of lateral ventricle; + = Measuring points of widths of third ventricle; x = Measuring points of widths of frontal horn; (with permission from Elsevier) [24].
Normally, the mesencephalon has a predominantly homogeneous aspect. However, in up to 90% of the IPD patients, the SN is clearly visible as a large hyperechogenic area in comparison to the surrounding brainstem tissue. The echo-intensity of a distinct anatomical structure within the brainstem and the basal ganglia can be judged qualitatively or quantitatively. However, attempts to use signal brightness to quantify the echogenicity of the SN failed; therefore, it is preferred that planimetric measurements of the echogenic area is undertaken [24]. Consequently, abnormal hyperechogenicity and hypoechogenicity of the SN are defined by an increase or a decrease in the size of the relating area, respectively in comparison with the size of the SN in controls [24,38].
The specific cut-off values for SN echogenicity depend on the specific ultrasound system used [7,17,39]. Approximately all the echogenic sizes on one side that are smaller than 0.20 cm2 are classified as normally echogenic; sizes between 0.20 cm2 and 0.25 cm2 are categorized as moderately hyperechogenic and sizes of 0.25 cm2 and greater, are classified as markedly hyperechogenic [18,39–41].
Hypoechogenicity of the SN – found in 10% of the healthy adult population – can also be classified in individuals in whom the sum of SN echogenic sizes of both sides is below one standard deviation of the mean of the general population (<0.21 cm2) [42]. For the quantitative method, excellent intra- and inter-observer agreement has been reported – with kappa values of 0.80-0.85 [17,40,43,44]. The LN as well the RN are always scored qualitatively: (hyper-, iso-, or hypoechogenic). In the same axial section as the mesencephalon are visible RN is a highly echogenic line. Low echogenicity is assumed if the echogenic line of the midbrain raphe is interrupted or is not visible; it is associated with depression in both patients with and without parkinsonism [30,31].
In order to visualize and measure the basal ganglia and ventricles, it is necessary to perform an ultrasound scan on a section through the thalami. This procedure is performed from the midbrain plane, tilting the ultrasound beam at an angle of approximately 10-20° upwards. At this section, the transverse diameter of the third ventricle and of the frontal horn of the contralateral lateral ventricle can be measured [45]. To ensure the accurate and reproducible measurement of the widths of the ventricles calculations using TCS are performed from the ipsilateral to the contralateral inner layer of the hyperechogenic ependyma. These TCS measurements of the widths of ventricles correspond well with CT and MRI data [26,45] and with greater correlation for the third ventricle [45].
The contralateral caudate nucleus and the lenticular nucleus are performed at the same level. Generally, these structures are isoechogenic to the surrounding brain parenchyma: thus, the basal ganglia are discernible only when its echo-intensity is abnormally increased [20]. An increase in echo-intensity of one or both of the LN might differentiate between aPS and IPD [18,29,30]. The results of several animal and postmortem studies demonstrated that SN hyperechogenicity is significantly correlated with an increase of its iron content [40,46,47]. It is still possible that other factors contribute to SN hyperechogenicity such as abnormal iron-protein bindings, gliosis, and structural changes of neurons or glial cells (atrophy, morphologic changes of cells) in the SN [48]. Lenticular nucleus hyperechogenicity is most likely to be caused by increased trace metal content [21,25].
TCS in the diagnosis of IPD
IPD is the second most common movement disorder and its incidence in the elderly population is in the order of 1-2%. The clinical picture is characterized by bradykinesia combined with rigidity, resting tremor, and postural instability in the later stages. However, in the early stages of the disease, when clinical symptoms are less noticeable, it is often difficult to provide a firm diagnosis.
Becker and colleagues first observed hyperechogenicity of the substantia nigra in IPD using TCS [49]. This echo feature is detected with high sensitivity and specificity [27] in more than 90% of patients with PD (Figure 2 C-D) [18,49].
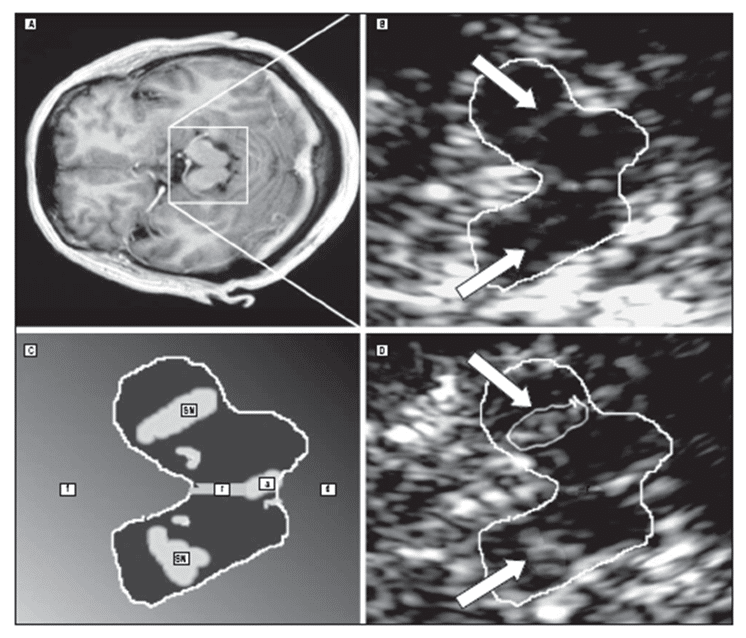
Figure 2. MRI and TCS at midbrain level in one patient with multiple system atrophy (A-B) and one patient with idiopathic Parkinson’s disease (C-D). The TCS image shows normal substantia nigra (SN) echogenicity in multiple system atrophy and marked hyperechogenicity in Parkinson’s disease (a indicates aqueduct; d dorsal; f, frontal; r, raphe); (with permission from AMA) [23].
A prospective blind study which included 60 patients with the first, but as yet undiagnosed clinical symptoms of parkinsonism, has shown that for a correct diagnosis of IPD in its early stages compared with the endpoint diagnosis, the sensitivity of TCS at baseline is 90.7%, the specificity is 82.4%, the positive predictive value is 92.9% and the classification accuracy is 88.3% [13].
In approximately 10% of a healthy control group, the hyperechogenicity of the SN can also observed. A recent study has proposed a clear association between this echo-abnormality in healthy people and subsequent development of PD [50]. In addition, asymptomatic individuals with hyperechogenicity of the SN on the TCS were found to have decreased fluorodopa F-18 uptake in the striatum [24].
The increase echogenicity of the SN is a stable marker because the area of echogenicity is not related to the disease stage or severity [17,51–53]. This echogenicity was found not to change during the course of disease progression during a 5-year follow-up period [54]. Hence, this ultrasound marker could be used for an early diagnosis of IPD, but not as a monitoring tool in the progression of IPD [24].
TCS in aPS
In clinical practice the correct differential diagnosis between IPD and aPS such as the parkinsonian variant of multiple system atrophy (MSA-P), progressive supranuclear palsy (PSP), dementia with Lewy bodies (DLB) or corticobasal degeneration (CBD) is still quite complicated and difficult.
The main criteria, that can clinically distinguish between these disorders, are the symptoms that occur in addition to the parkinsonian syndromes; e.g., autonomic symptoms in MSA-P; falls, gaze palsy, and axial rigidity in PSP; initially unilateral apraxia and amnestic aphasia in CBD; dementia, fluctuating cognition and visual hallucinations in DLB and little or no responsiveness to levodopa (L-DOPA) in MSA-P, PSP and CBD.
Consequently, in the early stages of these disease states, a large number of patients are erroneously diagnosed even by experienced, movement disorder specialists. It is possible to use postmortem findings as a gold standard [55,56]. Neuropathological studies have shown that even at end-stage disease the clinical diagnostic accuracy for IPD varies between 75-90%.
In the latter stages of MSA-P, PSP and CBD, neurodegeneration-associated brain atrophy is visible on MRI [57–59]. However, in the early stages of these disease – when these useful specific neuroimaging features are usually not present – functional neuroimaging can be used. Unfortunately, their sensitivity and specificity are not sufficiently high [8,24]. Moreover, neuroimaging methods, such as CT, MRI and PET, do not discriminate between IPD and DLB [60].
In particular at later stages – but also in the onset early in the course of the disease [13] – TCS was reported to discriminate IPD from MSA-P and PSP [2,57], with a high sensitivity and specificity [23,26,61]. This was applied and calculated using the frequency and the distribution of TCS abnormalities of the substantia nigra, lenticular nucleus and third ventricle (Figure 2 A-B) (Figure 3) [23,25,26].
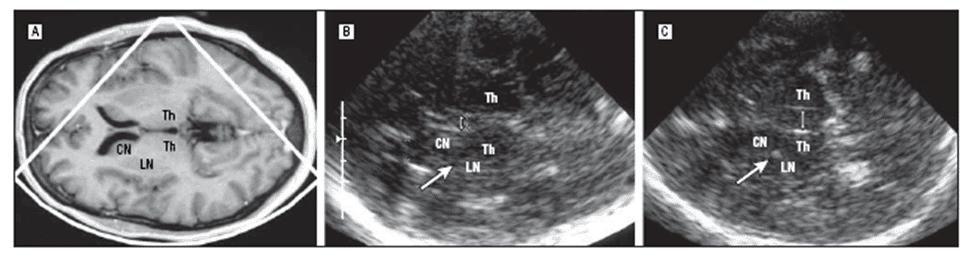
Figure 3. MRI and TCS of the brain and the thalamus level in one patient with IPD (A-B) and in one patient with PSP (C). The TCS image shows normal width of the third ventricle (double arrow) and lenticular nucleus (LN) in IPD while dilatation of the third ventricle and LN hyperechogenicity in the region of the globus pallidus internus (CN indicates caudate nucleus; Th, thalamus); (with permission from AMA) [23].
More specifically a pooled analysis of several studies [13,23,25,29,61] including 500 patients with adequate assessability on TCS, of whom 353 had definite PD, 86 had probable or possible MSA-P, and 61 had probable or possible PSP, has shown that hyperechogenicity of the SN and normal echogenicity of the basal ganglia has a positive predictive value of 91% for IPD [24]; normal echogenic SN combined with LN hyperechogenicity indicated MSA-P or PSP (sensitivity59%-specificity100%; positive predictive value 100%); normal echogenic SN indicated MSA-P rather than IPD (sensitivity 90%-specificity 98%; positive predictive value 86%); third-ventricle dilatation of more than 10 mm in combination with LN hyperechogenicity indicated PSP rather than IPD (sensitivity 84%-specificity 98%; positive predictive value 89%). In parkinsonism with an age at onset younger than 60 years, normal echogenic SN alone indicated MSA or PSP (sensitivity 75%- specificity 100%; positive predictive value 100%) [23].
PSP can occur with two main clinical presentations classified as classical Richardson’s syndrome (PSP-RS) and as PSP-parkinsonism (PSP-P). The most common atypical PSP variant PSP-RS is characterized by an insidious early onset of a symmetric akinetic-rigid syndrome with vertical supranuclear gaze palsy, early backwards falls and frontal dysfunction. PSP-P shows asymmetrical onset, tremor, rigidity, moderate initial response to levodopa (L-DOPA) at a later age of onset and a more favorable disease progression [62].
Recent studies [53,63,64], limited by a small number of patients (33 patients enrolled on average), have tried to detect different ultrasound markers by TCS in individuals with PSP-RS and PSP-P. The results obtained indicate that a finding of a hyperechogenic SN is more frequent in patients with PSP-P compared to patients with PSP-RS (P = 0.020); uni- or bilateral hyperechogenicity of the LN was observed more frequently in patients with PSP-RS (P = 0.101). The third ventricle was significantly wider in patients with PSP-RS, when compared with patients with PSP-P (P = 0.001) [53].
An extensive review by Berg et al. [24] reported that the combination of two TCS markers e.g., normal SN echogenicity and the LN hyperechogenicity had a high predictive value (at least 96%) for aPS, and might be applicable for patients with PSP-RS. However, combination of the SN hyperechogenicity and normal echogenicity of the basal ganglia is shown to be useful in prediction of PD [24] and may be inadequate for differentiation between IPD and PSP-P [53].
In addition to IPD, CBD and DLB are also associated with SN hyperechogenicity [23,26]. Interestingly, the SN echogenic sizes in both disease entities are comparable [26]. In DLB patients, compared with IPD patients, the SN hyperechogenicity is more frequently bilateral, significantly more pronounced and not related to an earlier disease onset.
Subsequently, a right-left asymmetry index ≥ 1.15 of SN echogenic sizes indicates IPD rather than DLB. Combination of SN echogenic sizes, asymmetry indices and age at disease onset discriminates IPD from DLB with a sensitivity of 96%, a specificity of 80% and a positive predictive value of 93%. The size, asymmetry and relation of SN hyperechogenicity to age at disease onset discriminate IPD from DLB [60].
TCS in secondary parkinsonian syndromes (sPS)
Secondary parkinsonian syndromes (sPS) includes symptoms of bradykinesia with rigidity, tremor, or both that are induced by causes other than degeneration of the nigrostriatal system. Since the clinical features of sPS and IPD are frequently similar, a correct clinical differentiation is often virtually impossible. Usually, the causes of sPS can be shown by structural neuroimaging techniques, such as CCT or MRI, which can reveal the cause of movement disorders [24].
TCS has the capability to identify many of the structural changes detected by the above mentioned neuroimaging techniques such as the enlargement of the ventricular system in hydrocephalus or the hyperechogenic calcification and traces of metal accumulation in the basal ganglia in metabolic disorders (Wilson’s disease or Fahr’s disease) [21,65]. The TCS findings for these disorders is equally important – or even more so – than the findings from CCT or MRI because calcification and the accumulation of heavy metals can be seen earlier with ultrasound [21,24,65]
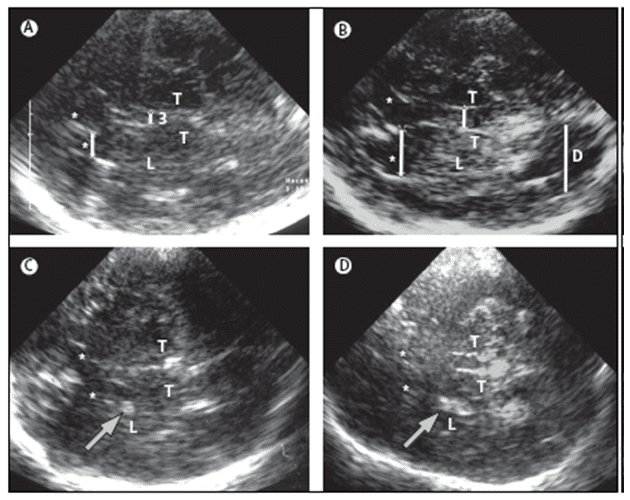
Nevertheless, the small vascular lesions that bring about vascular parkinsonism (VP) – clearly visible through CCT or MRI – are not visible with TCS [66]. This disadvantage can be counteracted by the fact that TCS can indicate whether hyperechogenicity of the SN is present which is characteristic of IPD and is not present in the sPS. The presence of a diagnostic marker for IPD is also useful in the differential diagnosis of a post-traumatic PS from IPD as hyperechogenicity of the SN is only found in the latter [67]. Therefore, TCS could be used to distinguish most of the above-mentioned differential diagnoses (Figure 4 B-D) [24].
.
Figure 4. TCS images of identical axial sections at the level of the thalamus from four individuals for diagnosis. The basal ganglia and ventricles are routinely assessed on TCS, at this level. (A) An individual with a healthy aspect of basal ganglia and ventricles. The thalamus is hypoechogenic. The lenticular nucleus and the head of the caudate nucleus are isoechogenic to the surrounding brain parenchyma and this usually can only be discerned by taking an anatomical aspect to the thalamus and ventricles into account. (B) Individual with pronounced dilatation of the third and lateral ventricles (hydrocephalus). Visibility of the dorsal horn of lateral ventricle, at this section is a sign of pronounced dilatation. (C) Individual with dot-like hyperechogenicity of the medial part of the lenticular nucleus. This is a typical finding in idiopathic dystonia, atypical PS and in neurologically asymptomatic Wilson’s disease. (D) Individual with extensive hyperechogenicity of lenticular nucleus, which is seen in severely affected patients with Wilson’s disease. For all images, the inserted lines indicate sites of measurement at widths of frontal horn and third ventricle. Bars indicate the location for measuring the width of the referring ventricle; arrows indicate hyperechogenic signals within the lenticular nucleus; 3 = third ventricle; L = lenticular nucleus; D = dorsal horn of lateral ventricle; T = thalamus; *Frontal horn of lateral ventricle; (with permission from Elsevier) [24].
TCS in other movement disorders
In the early stages of the disease it can also very difficult to differentiate clinically between a parkinsonian tremor and an essential tremor (ET). Although the diagnostic accuracy of presynaptic PET and SPECT imaging in the differential diagnosis between these two diseases is more than 90% [68,69] the wide application of these useful strategies is still limited.
Usually, patients affected by ET have no hyperechogenicity of the SN [61,70,71]. This feature, assessed through TCS, can help to differentiate between IPD and ET. However, in a study comparing SN areas of 44 ET patients with 100 controls and 100 IPD patients has been demonstrated that about three to four times more patients with ET show hyperechogenicity of the SN rather than healthy controls [71]. This finding is consistent with the fact that the risk of developing IPD is about three times to four times greater in patients with ET than in the general population [72].
Depressive disorders are frequently associated with parkinsonism; they may be consequences of the illness but also can be a premotor sign of IPD. Moreover, the risk for patients with depression in later development of IPD is about two to three times higher than the risk for individuals who are not suffering from a depressive illness [73,74].
Depression associated with motor slow down can be distinguished from IPD because only IPD is generally associated with hyperechogenicity of the SN. However, patients who have depressive disorders have about three times increased hyperechogenicity of the SN in comparison with the general population [75].
Differentiating between diagnosis of depression can be performed by using another ultrasound marker which is of considerable value. This is the low echogenicity of the RN; decreased RN echogenicity was found more often in depressed patients than in healthy controls without depression. Similarly, decreased RN echogenicity was more common in IPD patients with depression than in IPD patients without depression but also showing hyperechogenicity of the SN (Figure 5 E) [75,76].
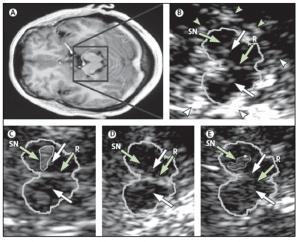
Figure 5. MRI and TCS images of identical midbrain axial sections from four individuals assessed for the diagnosis of PD or restless legs syndrome (A) MRI of the axial section at the level of the midbrain. The square box denotes the area corresponding to the magnified TCS image as shown in (B). (B) TCS image of the axial midbrain section in an individual with usual echogenicity of the SN and midbrain raphe. In the anatomical area of SN, only a tiny band (commonly only small patches) of increased echosignal is visible. The raphe is detected as a highly echogenic, continuous line. The bright echoes surrounding the brainstem (arrowheads), originate at the interfaces of the basal cisterns. (C) Individual with pronounced hyperechogenicity of the SN and usual echogenicity of the raphe. The echogenic area of the right SN is encircled for computerised measurement. Hyperechogenicity of the SN is characteristic in PD. (D) Individual with hypoechogenicity (invisible) of the SN despite clear appearance of the red nucleus and usual echogenicity of the raphe. This finding is common in primary restless legs syndrome. (E) Individual with hypoechogenicity (invisible) of the raphe, despite moderate hyperechogenicity of the SN and red nuclei. Hypoechogenicity of the raphe is frequent in depressive disorders and is thought to indicate alteration of the central serotonergic system. The white arrows show the red nuclei. R=raphe. (with permission from Elsevier) [24].
Therefore, low echogenicity of the RN and normal echogenicity of the SN in a patient with parkinsonism might suggest depression as the main cause for motor slow down. Whereby, low echogenicity of the RN but hyperechogenicity of the SN, might suggest that a disposition to IPD is possible [24]. It is important to realize that the hyperechogenicity of the SN can also be found in a certain percentage of patients with rare neurodegenerative diseases such as several forms of hereditary and non-hereditary ataxia [22–23].
There are two TCS case-control studies [22,77] including 30 and 66 patients respectively, which reported hyperechogenicity of SN, as a frequent finding in spinocerebellar ataxia (SCA) type 2, type 3, and type 17, indicating a vulnerability of the nigrostriatal system in SCA patients. A new ‘cerebellar examination plane’ was proposed, allowing for a better visualization of the fourth ventricle enlargement and nucleus dentatus hyperechogenicity, as a characteristic finding in SCA3 patients [78].
In sporadic Creutzfeldt-Jakob disease (CJD) a blurred in homogeneous hyperechogenic signal pattern of LN was identified, in all of the patients, in a small case study. Furthermore, distinct bilateral hyperechogenicity of pallidostriatal regions have been described as a novel diagnostic feature in the sonographic differentiation of extrapyramidal and ataxic movement disorders [78].
TCS also reveals signal alterations of basal ganglia in Huntington’s disease (HD). Distinct findings are related to all of the three symptom domains (motor, cognitive and psychiatric deficits) of the clinical triad of the disease. The TCS finding of SN hyperechogenicity was related to a higher clinical disease severity. Furthermore, a larger number of CAG repeats in the huntingtin gene, correlated with presence of SN hyperechogenicity. A poorer cognitive performance – correlated with larger width of third ventricle and depressive symptoms – was found to be associated with abnormal echogenicity of RN [79].
TCS scans could help in the assessment of restless legs syndrome, which is a common neurological disorder, characterized by a compulsive urge to move the legs or other body parts whilst at rest. In this syndrome the neuroimaging methods are substantially normal [80,81]. TCS has detected decreased echogenicity of the SN in more than 90% of patients with idiopathic restless legs syndrome and 60% of patients with symptomatic restless legs syndrome [28,42]. Also in this instance this TCS alteration was thought to depend on regional iron levels in the brain [82].
Hypoechogenicity of the SN could help to distinguish patients with restless legs syndrome from a healthy control group with high diagnostic accuracy and a positive predictive value of 0.94 (Figure 5 D) [83]. Although TCS seems to be a promising new tool for the diagnostic assessment of restless legs syndrome, data is still limited [24].
Finally, TCS could be a useful as a tool for diagnosing of dystonia which is characterized by involuntary muscle contractions, that can cause twisting or jerking movements in parts of/or the whole body. CCT and MRI can normally see the structural lesions that characterize some secondary forms of dystonia. However, the distinction of idiopathic dystonia from medication-induced (tardive) dystonia can be difficult because CCT and MRI scans are usually found to be normal [24].
By using TCS, a hyperechogenicity of the LN can be detected in up to 75% of patients with idiopathic cervical dystonia or upper-limb dystonia [84]. It can be shown that an increased echogenicity of the SN in only 31% of patients with facial dystonia whereas this echo feature is not usually seen in tardive dystonia [84]. Consequently, this ultrasound feature might be useful in distinguishing idiopathic dystonia from tardive or psychogenic dystonias (Figure 4 C) [24].
Limitations and advantages of TCS
The main limitation of TCS in the evaluation of SN hyperechogenicity is the dependence of image quality and/or the sonographer’s experience [85]. In regard to the quality of the temporal acoustic bone window, the midbrain structure (SN and RN) are not or are only partially assessable in 5-10% of white individuals and the basal ganglia in 10-20% of white individuals [30,85]. With regard to the dependency and/or the knowledge of the investigator, skills can be sharpened by experience in clinical in quite a short space of time frame [24].
The advantage of TCS is its usefulness in early, even preclinical stages of IPD and in differential diagnosis of distinct movement disorders. Whereas, in contrast to functional neuroimaging the TCS technique which is characterized by wide availability, non-invasiveness and short investigation times. On these grounds, TCS can be recommended without limitations, as an additional diagnostic instrument in routine tests for patients who present with suspected parkinsonism.
Conclusion
The diagnosis of IPD is a challenge since several other disorders can resemble the idiopathic form of the illness. These similar disorders can be divided into either secondary parkinsonian syndromes or atypical parkinsonian syndromes. TCS is a valid instrument for the diagnosis and differential diagnosis of IPD in its early stages [13]. Particularly in latter stages but also in early onset of the disease [13], the TCS is useful in differentiating idiopathic IPD from aPS, such as PSP and MSA-P, with high sensitivity and specificity [23,25,26,86].
The patients affected by PSP and MSA-P appear to have normal, or only moderately enhanced-hyperechogenic SN, as have patients with VP [66], and ET [70,71]. Moreover, the accuracy of the differential diagnosis can be enhanced by additional assessments of the echogenicity of the basal ganglia because in patients with PSP or MSA-P a LN hyperechogenicity can be detected.
Therefore, the pooled analysis of the echogenicity of the SN and LN can significantly increase the sensitivity, specificity and the positive predictive value of TCS for the differential diagnosis between IPD and aPS [23]. Patients with LBD [60] and CBD [26] have been reported to share the same echo feature with IPD patients. However, the hyperechogenicity of the LN is commonly seen in patients with CBD whereas patients with IPD only rarely have this feature.
Furthermore, research has shown that the absence of bilateral marked SN hyperechogenicity discriminates IPD from LBD with a moderate-to-good sensitivity and a good specificity with a positive predictive value [60]. IPD is characterized by a long premotor period that lasts for several years [46]. In fact, it has been shown that more than 50% of the dopaminergic neurons of the SN will have degenerated before clinical diagnosis can be established and the first motor symptoms have surfaced [3,4].
SN hyperechogenicity is already present in about 9% of healthy individuals [40,49]. This echo-abnormality is associated with the vulnerability of the nigrostriatal system. Earlier studies have shown that PET or SPECT scans are also abnormal in up to 60% of the asymptomatic patients with an abnormal TCS [24,40,86–88]. Additionally, one study demonstrated a clear association between SN hyperechogenicity in healthy people and subsequent development of PD [50].
Previous TCS studies demonstrated that SN hyperechogenicity is a stable, early biomarker that does not change during the course of IPD. Consequently, the evaluation of SN echogenicity by TCS, constitutes a promising screening instrument in a population at risk from IPD. In fact, this technique is capable of performing an early preclinical diagnosis, that allows starting treatment in the premotor stage, before the majority of neurons are lost with consequently greater neuroprotective effect [41,50,54,89].
Conflict of interest
The authors confirm that this article content has no conflict of interest.
References
Key References: 13, 23, 24, 25, 26, 27, 28, 29, 30, 31
- Litvan I, Agid Y, Jankovic J, et al. Accuracy of clinical criteria for the diagnosis of progressive supranuclear palsy (Steele-Richardson-Olszewski syndrome). Neurology. 1996; 46(4): 922-930. [CrossRef] [PubMed Abstract]
- Zijlmans JC, Daniel SE, Hughes AJ, Revesz T, Lees AJ. Clinicopathological investigation of vascular parkinsonism, including clinical criteria for diagnosis. Mov Disord. 2004; 19(6): 630-640. [CrossRef] [PubMed Abstract]
- Braak H, Ghebremedhin E, Rüb U, Bratzke H, Del Tredici K. Stages in the development of Parkinson’s disease-related pathology. Cell Tissue Res. 2004; 318(1): 121-134. [CrossRef] [PubMed Abstract]
- Fearnley JM, Lees AJ. Ageing and Parkinson’s disease: substantia nigra regional selectivity. Brain. 1991; 114: 2283-2301. [CrossRef] [PubMed Abstract]
- Litvan I, Agid Y, Calne D, et al. Clinical research criteria for the diagnosis of progressive supranuclear palsy (Steele-Richardson-Olszewski syndrome): report of the NINDS-SPSP international workshop. Neurology. 1996; 47(1): 1-9. [CrossRef] [PubMed Abstract]
- Wenning GK, Ben-Shlomo Y, Hughes A, Daniel SE, Lees A, Quinn NP. What clinical features are most useful to distinguish definite multiple system atrophy from Parkinson’s disease? J Neurol Neurosurg Psychiatry. 2000; 68 (4): 434-440. [CrossRef] [PubMed Abstract]
- Schrag A, Good CD, Miszkiel K, et al. Differentiation of atypical parkinsonian syndromes with routine MRI. Neurology. 2000; 54(3): 697-702. [CrossRef] [PubMed Abstract]
- Ravina B, Eidelberg D, Ahlskog JE, et al. The role of radiotracer imaging in Parkinson disease. Neurology. 2005; 64(2): 208-215. [CrossRef] [PubMed Abstract]
- Vlaar AM, van Kroonenburgh MJ, Kessels AG, Weber WE. Meta-analysis of the literature on diagnostic accuracy of SPECT in parkinsonian syndromes. BMC Neurol. 2007; 7: 27. [CrossRef] [PubMed Abstract]
- Ciarmiello A, Giovannini E, Meniconi M, Cuccurullo V, Gaeta MC. Hybrid SPECT/CT imaging in neurology. Curr Radiopharm. 2014; 7(1): 5-11. [CrossRef] [PubMed Abstract]
- Eckert T, Barnes A, Dhawan V, et al. FDG PET in the differential diagnosis of parkinsonian disorders. Neuroimage. 2005; 26: 912-921. [CrossRef] [PubMed Abstract]
- Hellwig S, Amtage F, Kreft A, et al. [18F]FDG-PET is superior to [123I]IBZM-SPECT for the differential diagnosis of parkinsonism. Neurology. 2012; 79: 1314-1322. [CrossRef] [PubMed Abstract]
- Gaenslen A, Unmuth B, Godau J, Liepelt I, Di Santo A, Schweitzer KJ, et al. The specificity and sensitivity of transcranial ultrasound in the differential diagnosis of Parkinson’s disease: a prospective blinded study. Lancet Neurol. 2008; 7(5): 417-424. [CrossRef] [PubMed Abstract]
- Hennerici MG, Meairs SP. Cerebrovascular Ultrasound: Theory, Practice and Future Developments. 2001; First edition ed. Cambridge, U.K.: Cambridge University Press. [Reference Source]
- Becker G, Perez J, Krone A, et al. Transcranial color-coded real-time sonography in the evaluation of intracranial neoplasms and arteriovenous malformations. Neurosurgery. 1992; 31: 420-428. [CrossRef] [PubMed Abstract]
- Woydt M, Greiner K, Perez J, Becker G, Krone A, Roosen K. Transcranial duplex-sonography in intracranial hemorrhage. Evaluation of transcranial duplex-sonography in the diagnosis of spontaneous and traumatic intracranial hemorrhage. Zentralbl Neurochir. 1996; 57: 129-135. [PubMed Abstract]
- Berg D, Siefker C, Becker G. Echogenicity of the substantia nigra in Parkinson’s disease and its relation to clinical findings. J Neuro. 2001; 248: 684-689. [CrossRef] [PubMed Abstract]
- Walter U, Wittstock M, Benecke R, Dressler D. Substantia nigra echogenicity is normal in non-extrapyramidal cerebral disorders but increased in Parkinson’s disease. J Neural Trans. 2002; 109: 191-196. [PubMed Abstract]
- Becker G, Berg D. Neuroimaging in basal ganglia disorders: perspectives for transcranial ultrasound. Mov Disord. 2001; 16: 23-32. [CrossRef] [PubMed Abstract]
- Postert T, Lack B, Kuhn W, et al. Basal ganglia alterations and brain atrophy in Huntington’s disease depicted by transcranial real time sonography. J Neurol Neurosurg Psychiatr. 1999; 67: 457-462. [CrossRef] [PubMed Abstract]
- Walter U, Krolikowski K, Tarnacka B, Benecke R, Czlonkowska A, Dressler D. Sonographic detection of basal ganglia lesions in asymptomatic and symptomatic Wilson disease. Neurology. 2005; 64: 1726-1732. [CrossRef] [PubMed Abstract]
- Postert T, Eyding J, Berg D, et al. Transcranial sonography in spinocerebellar ataxia type 3. J Neural Transm Suppl. 2004; 68:123-133. [CrossRef] [PubMed Abstract]
- Walter U, Dressler D, Probst T, et al. Transcranial brain sonography findings in discriminating between parkinsonism and idiopathic Parkinson disease. Arch Neurol. 2007; 64(11): 1635-1640. [CrossRef] [PubMed Abstract]
- Berg D, Godau J, Walter U. Transcranial sonography in movement disorders. Lancet Neurol. 2008; 7:1044-1055. [CrossRef] [PubMed Abstract]
- Walter U, Niehaus L, Probst T, Benecke R, Meyer BU, Dressler D. Brain parenchyma sonography discriminates Parkinson’s disease and atypical parkinsonian syndromes. Neurology. 2003; 60(1): 74-77. [CrossRef] [PubMed Abstract]
- Walter U, Dressler D, Wolters A, Probst T, Grossmann A, Benecke R. Sonographic discrimination of corticobasal degeneration vs progressive supranuclear palsy. Neurology. 2004; 63: 504-509. [CrossRef] [PubMed Abstract]
- Prestel J, Schweitzer KJ, Hofer A, Gasser T, Berg D. Predictive value of transcranial sonography in the diagnosis of Parkinson’s disease. Mov Disord. 2006; 21: 1763-1765. [CrossRef] [PubMed Abstract]
- Schmidauer C, Sojer M, Seppi K, et al. Transcranial ultrasound shows nigral hypoechogenicity in restless legs syndrome. Ann Neurol. 2005; 58(4): 630-634. [CrossRef] [PubMed Abstract]
- Behnke S, Berg D, Naumann M, Becker G. Differentiation of Parkinson’s disease and atypical parkinsonian syndromes by transcranial ultrasound. J Neurol Neurosurg Psychiatry. 2005; 76(3): 423-425. [CrossRef] [PubMed Abstract]
- Walter U, Behnke S, Eyding J, et al. Transcranial brain parenchyma sonography in movement disorders: state of the art. Ultrasound Med Biol. 2007; 33(1): 15-25. [CrossRef] [PubMed Abstract]
- Becker G, Becker T, Struck M, et al. Reduced echogenicity of brainstem raphe specific to unipolar depression: a transcranial color-coded real-time sonography study. Biol Psychiatry. 1995; 38(3): 180-184. [CrossRef] [PubMed Abstract]
- Poewe W. The need for neuroprotective therapies in Parkinson’s disease: a clinical perspective. Neurology. 2006; 66(10, suppl 4): S2-S9. [CrossRef] [PubMed Abstract]
- Stern MB, Siderowf A. Parkinson’s at risk syndrome: can Parkinson’s disease be predicted? Mov Disord. 2010; 25(suppl 1): S89-S93. [CrossRef] [PubMed Abstract]
- Claudon M, Tranquart F, Evans DH, Lefevre F, Correas M. Advances in ultrasound. Eur Radiol. 2002; 12: 7-18. [CrossRef] [PubMed Abstract]
- Cosgrove D. Developments in ultrasound. Imaging. 2006; 18: 82-96. [CrossRef]
- Walter U, Kanowski M, Kaufmann J, Grossmann A, Benecke R, Niehaus L. Contemporary ultrasound systems allow high-resolution transcranial imaging of small echogenic deep intracranial structures similarly as MRI: a phantom study. Neuroimage. 2008; 40: 551-558. [CrossRef] [PubMed Abstract]
- Berg D, Behnke S, Walter U. Application of transcranial sonography in extrapyramidal disorders: updated recommendations. Ultraschall Med. 2006; 27: 12-19. [CrossRef] [PubMed Abstract]
- Vlaar AM, Bouwmans A, Mess WH, et al. Transcranial duplex in the differential diagnosis of parkinsonian syndromes: a systematic review. J Neurol. 2009; 256: 530-538. [CrossRef] [PubMed Abstract]
- Glaser M, Weber U, Hinrichs H, Niehaus L. Neuroimaging of midbrain structures with different phased-array ultrasound systems. Klin Neurophysiol. 2006; 37: 165-168 (in German). [CrossRef]
- Berg D, Becker G, Zeiler B, et al. Vulnerability of the nigrostriatal system as detected by transcranial ultrasound. Neurology. 1999; 53: 1026-1031. [CrossRef] [PubMed Abstract]
- Berg D, Roggendorf W, Schroder U, et al. Echogenicity of the substantia nigra: association with increased iron content and marker for susceptibility to nigrostriatal injury. Arch Neurol. 2002; 59(6): 999-1005. [CrossRef] [PubMed Abstract]
- Godau J, Schweitzer KJ, Liepelt I, Gerloff C, Berg D. Substantia nigra hypoechogenicity: definition and findings in restless legs syndrome. Mov Disord. 2007; 22: 187-192. [CrossRef] [PubMed Abstract]
- Budisic M, Trkanjec Z, Bosnjak J, Lovrencic-Huzjan A, Vukovic V, Demarin V. Distinguishing Parkinson’s disease and essential tremor with transcranial sonography. Acta Neurol Scand. 2009; 119(1): 17-21. [CrossRef] [PubMed Abstract]
- Huang YW, Jeng JS, Tsai CF, Chen LL, Wu RM. Transcranial imaging of substantia nigra hyperechogenicity in a Taiwanese cohort of Parkinson’s disease. Mov Disord. 2007; 22(4): 550-555. [CrossRef] [PubMed Abstract]
- Seidel G, Kaps M, Gerriets T, Hutzelmann A. Evaluation of the ventricular system in adults by transcranial duplex sonography. J Neuroimaging. 1995; 5: 105-108. [PubMed Abstract]
- Zecca L, Berg D, Arzberger T, et al. In vivo detection of iron and neuromelanin by transcranial sonography: a new approach for early detection of substantia nigra damage. Mov Disord. 2005; 20: 1278-1285. [CrossRef] [PubMed Abstract]
- Berg D. Disturbance of iron metabolism as a contributing factor to SN hyperechogenicity in Parkinson’s disease: implications for idiopathic and monogenetic forms. Neurochem Res. 2007; 32(10): 1646-1654. [CrossRef] [PubMed Abstract]
- Sˇkoloudík D, Walter U. Method and validity of transcranial sonography in movement disorders. Int Rev Neurobiol. 2010; 90: 7-34. [PubMed Abstract]
- Becker G, Seufert J, Bogdahn U, Reichmann H, Reiners K. Degeneration of substantia nigra in chronic Parkinson’s disease visualized by transcranial color-coded realtime sonography. Neurology. 1995; 45: 182-184. [PubMed Abstract]
- Berg D, Seppi K, Behnk S, et al. Enlarged Substantia Nigra Hyperechogenicity and Risk for Parkinson Disease. Arch Neurol. 2011;68 (7): 932-937. [CrossRef] [PubMed Abstract]
- Spiegel J, Hellwig D, Mollers MO, et al. Transcranial sonography and [123I]FP-CIT SPECT disclose complementary aspects of Parkinson’s disease. Brain. 2006; 129: 1188-1193. [CrossRef] [PubMed Abstract]
- Walter U, Dressler D, Wolters A, Wittstock M, Benecke R. Transcranial brain sonography findings in clinical subgroups of idiopathic Parkinson’s disease. Mov Disord. 2007; 22: 48-54. [CrossRef] [PubMed Abstract]
- Kostic VS, Mijajlovic M, Smajlovic D, et al. Transcranial brain sonography findings in two main variants of progressive supranuclear palsy. European Journal of Neurology. 2013; 20: 552-557. [CrossRef] [PubMed Abstract]
- Berg D, Merz B, Reiners K, Naumann M, Becker G. Five-year follow-up study of hyperechogenicity of the substantia nigra in Parkinson’s disease. Mov Disord. 2005; 20: 383-385. [CrossRef] [PubMed Abstract]
- Hughes AJ, Daniel SE, Kilford L, et al. Accuracy of clinical diagnosis of idiopathic Parkinson’s disease: a clinico-pathological study of 100 cases. J Neurol Neurosurg Psychiatry. 1992; 55: 181-184. [CrossRef] [PubMed Abstract]
- Ahlskog JE. Diagnosis and differential diagnosis of Parkinson’s disease and parkinsonism. Parkinsonism Relat Disord. 2000; 7(1): 63-70. [CrossRef] [PubMed Abstract]
- Watanabe H, Saito Y, Terao S, et al. Progression and prognosis in multiple system atrophy: an analysis of 230 Japanese patients. Brain. 2002; 125(5): 1070-1083. [CrossRef] [PubMed Abstract]
- Warmuth-Metz M, Naumann M, Csoti I, Solymosi L. Measurement of the midbrain diameter on routine magnetic resonance imaging: a simple and accurate method of differentiating between Parkinson disease and progressive supranuclear palsy. Arch Neurol. 2001; 58: 1076-1079. [CrossRef] [PubMed Abstract]
- Huang KJ, Lu MK, Kao A, Tsai CH. Clinical, imaging and electrophysiological studies of corticobasal degeneration. Acta Neurol Taiwan. 2007; 16: 13-21. [PubMed Abstract]
- Walter U, Dressler D, Wolters A, et al. Sonographic discrimination of dementia with Lewy bodies and Parkinson’s disease with dementia. J Neurol. 2006; 253: 448-454. [CrossRef] [PubMed Abstract]
- Okawa M, Miwa H, Kajimoto Y, et al. Transcranial sonography of the substantia nigra in Japanese patients with Parkinson’s disease or atypical parkinsonism: clinical potential and limitations. Intern Med. 2007; 46: 1527-1531. [CrossRef] [PubMed Abstract]
- Williams DR, de Silva R, Paviour DC, et al. Characteristics of two distinct clinical phenotypes in pathologically proven progressive supranuclear palsy: Richardson’s syndrome and PSP-parkinsonism. Brain. 2005; 128: 1247-1258. [CrossRef] [PubMed Abstract]
- Bouwmans AEP, Vlaar AMM, Srulijes K, Mess WH, Weber WEJ. Transcranial sonography for the discrimination of idiopathic Parkinson’s disease from the atypical parkinsonian syndromes. Int Rev Neurobiol. 2010; 90: 121-146. [CrossRef] [PubMed Abstract]
- Ebentheuer J, Canelo M, Trautmann E, Trenkwalder C. Substantia nigra echogenicity in progressive supranuclear palsy. Mov Disord. 2010; 25: 773-777. [CrossRef] [PubMed Abstract]
- Walter U, Dressler D, Lindemann C, Slachevsky A, Miranda M. Transcranial sonography findings in welding-related Parkinsonism in comparison to Parkinson’s disease. Mov Disord. 2008; 23: 141-145. [CrossRef] [PubMed Abstract]
- Tsai CF, Wu RM, Huang YW, Chen LL, Yip PK, Jeng JS. Transcranial color-coded sonography helps differentiation between idiopathic Parkinson’s disease and vascular parkinsonism. J Neurol. 2007; 254: 501-507. [CrossRef] [PubMed Abstract]
- Kivi A, Trottenberg T, Kupsch A, Plotkin M, Felix R, Niehaus L. Levodopa-responsive posttraumatic parkinsonism is not associated with changes of echogenicity of the substantia nigra. Mov Disord. 2005; 20: 258-260. [CrossRef] [PubMed Abstract]
- Asenbaum S, Pirker W, Angelberger P, Bencsits G, Pruckmayer M, Brucke T. [123I]beta-CIT and SPECT in essential tremor and Parkinson’s disease. J Neural Transm. 1998; 105: 1213-1228. [PubMed Abstract]
- Benamer TS, Patterson J, Grosset DG, et al. Accurate differentiation of parkinsonism and essential tremor using visual assessment of [123I]-FP-CIT SPECT imaging: the [123I]-FP-CIT study group. Mov Disord. 2000; 15: 503-510. [CrossRef] [PubMed Abstract]
- Doepp F, Plotkin M, Siegel L, et al. Brain parenchyma sonography and 123I-FP-CIT SPECT in Parkinson’s disease and essential tremor. Mov Disord. 2008; 23: 405-410. [PubMed Abstract]
- Stockner H, Sojer M, Seppi K, et al. Midbrain sonography in patients with essential tremor. Mov Disord. 2007; 22: 414-417. [CrossRef] [PubMed Abstract]
- Zorzon M, Capus L, Pellegrino A, Cazzato G, Zivadinov R. Familial and environmental risk factors in Parkinson’s disease: a casecontrol study in north-east Italy. Acta Neurol Scand. 2002; 105: 77-82. [PubMed Abstract]
- Schuurman AG, van den Akker M, Ensinck KT, et al. Increased risk of Parkinson’s disease after depression: a retrospective cohort study. Neurology. 2002; 58:1501-1504. [CrossRef] [PubMed Abstract]
- Leentjens AF, Van den Akker M, Metsemakers JF, Lousberg R, Verhey FR. Higher incidence of depression preceding the onset of Parkinson’s disease: a register study. Mov Disord. 2003; 18: 414-418. [CrossRef] [PubMed Abstract]
- Walter U, Hoeppner J, Prudente-Morrissey L, Horowski S, Herpertz SC, Benecke R. Parkinson’s disease-like midbrain sonography abnormalities are frequent in depressive disorders. Brain. 2007; 130: 1799-1807. [CrossRef] [PubMed Abstract]
- Becker T, Becker G, Seufert J, et al. Parkinson‘s disease and depression: evidence for an alteration of the basal limbic system detected by transcranial sonography. J Neurol Neurosurg Psychiatry. 1997; 63: 590-596. [CrossRef] [PubMed Abstract]
- Mijajlović M, Dragasević N, Stefanova E, Petrović I, Svetel M, Kostić VS. Transcranial sonography in spinocerebellar ataxia type 2. J Neurol. 2008; 255(8): 1164-1167. [CrossRef] [PubMed Abstract]
- Krogias C, Postert T, Eyding J. Transcranial sonography in ataxia. Int Rev Neurobiol. 2010; 90: 217-235. [CrossRef] [PubMed Abstract]
- Krogias C, Eyding J, Postert T. Transcranial sonography in Huntington’s disease. Int Rev Neurobiol. 2010; 90: 237-257. [CrossRef] [PubMed Abstract]
- Connor JR, Boyer PJ, Menzies SL, et al. Neuropathological examination suggests impaired brain iron acquisition in restless legs syndrome. Neurology. 2003; 61: 304-309. [CrossRef] [PubMed Abstract]
- Etgen T, Draganski B, Ilg C, et al. Bilateral thalamic gray matter changes in patients with restless legs syndrome. Neuroimage. 2005; 24: 1242-1247. [CrossRef] [PubMed Abstract]
- Godau J, Klose U, Di Santo A, Schweitzer K, Berg D. Multiregional brain iron deficiency in restless legs syndrome. Mov Disord. 2008; 23:1184-1187. [CrossRef] [PubMed Abstract]
- Godau J, Wevers AK, Gaenslen A, et al. Sonographic abnormalities of brainstem structures in restless legs syndrome. Sleep Med. 2008; 7: 782-789. [CrossRef] [PubMed Abstract]
- Becker G, Naumann M, Scheubeck M, et al. Comparison of transcranial sonography, magnetic resonance imaging, and single photon emission computed tomography findings in idiopathic spasmodic torticollis. Mov Disord. 1997; 12: 79-88. [CrossRef] [PubMed Abstract]
- Skoloudík D, Fadrná T, Bártová P, et al. Reproducibility of sonographic measurement of the substantia nigra. Ultrasound Med Biol. 2007; 33: 1347-1352. [PubMed Abstract]
- Ruprecht-Dorfler P, Berg D, Tucha O, et al. Echogenicity of the substantia nigra in relatives of patients with sporadic Parkinson’s disease. Neuroimage. 2003; 18(2): 416-422. [CrossRef] [PubMed Abstract]
- Sommer U, Hummel T, Cormann K, et al. Detection of presymptomatic Parkinson’s disease: combining smell tests, transcranial sonography, and SPECT. Mov Disord. 2004; 19(10): 1196-1202. [CrossRef] [PubMed Abstract]
- Skoloudík D, Jelínková M, Blahuta J, et al. Transcranial Sonography of the Substantia Nigra: Digital Image Analysis. AJNR Am J Neuroradiol. 2014 Jul 24; (PMID:25059698). [PubMed Abstract]
- Walter U, Klein C, Hilker R, Benecke R, Pramstaller PP, Dressler D. Brain parenchyma sonography detects preclinical parkinsonism. Mov Disord. 2004; 19: 1445-1449. [CrossRef] [PubMed Abstract]
Article information
Corresponding author: Massimiliano Godani.
Copyright: © 2014 Godani M et al.
How to cite: Godani M, Canavese F, Del Sette M, Walter U. Update on transcranial sonography applications in movement disorders. J. Diagn. Imaging Ther. 2014; 1(1): 110-128 (https://dx.doi.org/10.17229/jdit.2014-1113-008).
Article history: Received 18 October 2014; Revised 13 November 2014; Accepted 13 November 2014; Published online 13 November 2014.
Archive link: JDIT-2014-1113-008
home »