RESEARCH ARTICLE
Laura Evangelista1*, Marco Maruzzo2, Umberto Basso2, Anna Rita Cervino1, Vittorina Zagonel2, Pasquale Reccia1, Lea Cuppari1, Marta Burei1, Luigi Mansi3
1Nuclear Medicine and Molecular Imaging Unit, Veneto Institute of Oncology IOV – IRCCS, Padua, Italy
2Medical Oncology 1 Unit, Veneto Institute of Oncology IOV- IRCCS, Padua, Italy
3Centro interuniversitario di ricerca per lo sviluppo sostenibile (CIRPS), Napoli-Roma, Italy
Abstract
To evaluate the use of serial 18F-choline (FCH) PET/CT scans in order to monitor the response to chemotherapy in patients (pts) with metastatic castrate resistant prostate cancer (mCRPCa). Materials and methods. We collected FCH-PET/CT data from a consecutive series of 21 mCRPCa pre-treated pts (median age:73 years) who met the inclusion criteria: such as visceral and non-visceral metastasis with clear uptake on a baseline FCH-PET/CT scan and no fewer than two scans separated by at least one month and by no more than 12 months whilst receiving chemotherapy. Eighteen pts were treated by taxanes and 3 with abiraterone. Change in FCH uptake (SUVmax of the index lesion; ΔSUVmax) during the course of treatment was compared with the clinical assessment response and PSA change (ΔPSA). The correlations were evaluated by using non-parametric tests, as appropriate. Results. The median interval time between PET/CT scans was 5 months (interquartile range-IQR: 3-7). Median (IQR) PSA value and SUVmax were 25(7.22-141) ng/mL, 15.7(11.3-17.83), 22.9(7.7-92.5) ng/mL and 5.5(7.21-19.1) ng/mL respectively at the time of baseline and 2nd PET/CT. The median ΔPSA and ΔSUVmax were -49.9% and 8.3%, respectively. No correlation between ΔPSA and ΔSUVmax was found (r=0.046; p=0.843). In accordance with the clinical assessment, 8 pts were responders, 4 had a stable and 9 a progressive disease. A significant overlap was reported for ΔPSA and clinical categories of response (p=0.685). Conversely, ΔSUVmax was significantly different in pts with a response to chemotherapy as compared to those with stable and progressive disease (p=0.005). Conclusions. ΔSUVmax, rather than ΔPSA, represents an important measure of response to chemotherapy and should be useful to stratify the prognosis of mCRPCa pts. A large multicenter prospective study is necessary to confirm these findings.
Keywords: chemotherapy; fluorocholine; positron emission tomography; prostate cancer; response
Introduction
Prostate cancer is the most frequent tumor in males and both the availability of prostate specific antigen (PSA) testing and the extension of median life expectancy are responsible for a significant increase of incidence registered in the last decades.
Endocrine therapies (either luteinizing hormone-releasing hormone analogues, anti-androgens or combined) represent the first-choice for patients found with advanced disease at diagnosis or relapsing after local treatments, with an average time to progression (TTP) of 18-24 months to the so-called “Castrate-resistant” phase when diseases progresses notwithstanding low levels of circulating testosterone[1]. Approximately 10-20% of patients with localized prostate cancer developed metastatic castrate-resistant prostate cancer (mCRPCa) within 5-years of follow-up after initial therapy, while the majority of patients with metastatic disease at diagnosis become castrate-resistant within a shorter interval time [2]. More than 80% of mCRCPa patients have bone metastases, with or without the coexistence of nodal or visceral metastases [3].
The process by which prostate cancer cells become castrate resistant is unclear, but it is characterized by overexpression or hyperactivation of the androgen receptor despite castrate levels of androgen [4].
Docetaxel has long been the only treatment able to improve survival of mCRPCa and still represents the first cytotoxic option. Following docetaxel, patients have currently now at least three further options with the ability to impact on survival: namely cabazitaxel, abiraterone acetate and enzalutamide. However, to date, there are no clear guidelines indicating which treatment should be prescribed first or which patients would respond best to the different treatment options. Finally, 223-radium has been a proven treatment for mCRPCa, with excellent palliative effects as well as increases in overall survival [5,6].
In the clinical practice setting, there is a strong need to assess the response to chemotherapy for several reasons: (1) to determine the real efficacy of treatments;(2) to decide to stop or to continue the ongoing therapeutic scheme and (3) to assess the benefit of treatments on the disease course (how the disease behaves over time).
However, PSA is not always the most reliable method to understand the response to systemic therapy and therefore alternatives are required. A study by Al-Saeedi et al. [7] suggested the hypothesis that choline uptake could be changed before and after therapy and consequently, it may be indicative of tumor response. Since serum PSA alone is not a reliable marker for quantifying response to therapy, radiolabelled choline positron emission tomography (PET)/computed tomography (CT) could be proposed as an alternative imaging tool for the assessment of response to therapy.
While the European Organization for Research and Treatment of Cancer Criteria based on tumor glucose metabolism variations using 18F-fluorodoxyglucose PET/CT are well standardized, the role of alternative PET compounds, such as radiolabelled choline (either 11C and 18F-choline), in the assessment and prediction of responses to cancer treatment has not yet been thoroughly investigated in large series, but in a small cohort of patients during abiraterone and enzalutamide treatments [8,10].
There is a lack in the current literature on this topic. Therefore, we performed a retrospective study on mCRPCa patients followed at our Institution in order to evaluate the usefulness of serial 18F-fluoromethylcholine (FCH) PET/CT scans to monitor the response to chemotherapy. Moreover, as secondary end-point, we assessed the correlation between standardized uptake value (SUV) changes and the final outcome of the patients.
Materials and methods
Patient population
A retrospective analysis was performed on medical records of mCRPCa patients undergoing systemic treatments and serial FCH-PET/CT between March 2011 and May 2014. Inclusion criteria for this study were:
(1) patients with histological diagnosis of prostate cancer, any Gleason, any type of local treatment;
(2) mCRPCa disease with bone and/or visceral metastases showing a pathologic uptake on a baseline FCH-PET/CT scan which is confirmed by biopsy or conventional imaging (such as bone scan, magnetic resonance imaging (MRI), CT and radiography);
(3) no fewer than two FCH-PET/CT scans separated by at least one month and by no more than 12 months whilst receiving therapy;
(4) treatment with systemic anticancer agents for mCRPCa, first or subsequent line; 4) no therapy at the time of baseline FCH-PET/CT; 4) no granulocyte colony-stimulating factor for at least two weeks before FCH-PET/CT.
Twenty subjects fulfilled the inclusion criteria. All patients provided written informed consent for access to their medical records and use of aggregated clinical data for scientific purposes before their initial FCH-PET/CT examination according to our Institutional guidelines.
The research was performed in accordance with the Declaration of Helsinki.
FCH PET/CT examination
Prior to PET/CT examination with FCH, the patient was kept fasting for at least 6 hours without any restrictions for water intake. FCH (provided by IASON GmbH Graz, Austria), was administered intravenously with a scheduled activity of 3 MBq/kg body mass administered intravenously. To prevent incomplete administration and subcutaneous accumulation and to ensure good hydration, the radiopharmaceutical agent was injected in an infusion line connected to saline. A PET/CT camera (Biograph 16 enriched with high definition software, by Siemens) was used for PET imaging, with low dose CT acquired first. PET/CT whole-body acquisition was commenced 60 minutes after the FCH injection, covering a field of view from the skull to the knees. No dynamic PET was used. The PET data were reconstructed over a 128 x 128 matrix with 4.75 mm pixel size and 2 mm slice thickness. Processed images were displayed in coronal, transverse, and sagittal planes. PET/CT images were also assessed quantitatively using the maximum and average standardized uptake value (SUVmax and SUVavg, respectively) that was computed according to the following formula:
K (SUV) = K (Bq/cc) x [Weight (Kg)/Dose (Bq)] x 1000 cc/Kg
(where: K (Bq/cc) = calibrated and scaled Pixel volume and Dose (Bq) = injected dose in Bq at injection time with decay corrected).
All PET images were read by two trained nuclear medicine specialists, independently. At visual analysis, increased FCH uptake on the basis of either highly suspicious or definite CT morphologic changes and not corresponding to physiological uptake patterns were recorded as positive for metastases. On the contrary, the absence of uptake out of normal physiological sites, was used to define a negative PET/CT finding. SUVmax and SUVavg at the site of the most prominent FCH uptake was prospectively recorded on the baseline scan, and this site was designated as the index lesion. The SUVs of the index lesion served as the primary means for evaluating the change in FCH uptake over serial scans. The SUVs of the index lesion were recovered in each site (bone, lymph node, prostate gland or prostatic fossae, lung etc.).
Treatment
Patients were treated according to both normal practice of care and the National and International guidelines [11,12] with anticancer drugs approved for mCRPCa. Treatment was administered until there was progression or unacceptable toxicity.
Assessment of response
Change in FCH uptake during the course of treatment was compared with clinical assessment of response (as reference). Clinical information included serial measures of PSA values, conventional images (such as CT, bone scan and MRI) and subjective symptoms changes (pain and other disease-related symptoms). Response to treatment was categorized as response, stable disease, or progression according to the Prostate Cancer Clinical Trials Working Group 2 criteria [13]. Criteria for classification into the categories included size and number of metastatic sites at conventional imaging, change in tumor marker and symptom changes. Due to the retrospective nature of this study, there were no standard time intervals between PET scans, but most patients were expected to undergo a second PET/CT within 4 months from the first assessment. To compare FCH PET/CT results with clinical parameters, the response to therapy was first evaluated separately by two board-certified medical oncologists specialized in the treatment of prostate cancer and one board-certified nuclear medicine physician, and then a comparison made.
Clinical outcomes
Progression was defined as either an increase in PSA value(s) (>50%), and/or symptomatic progression, and/or progression determined by an imaging modality other than FCH PET/CT (CT, MRI, bone scan, radiography). Due to the relatively low number of patients, we did not assess separately the type of progression (biochemical, clinical or radiological).
Subsequently, as with the decline in PSA, we divided the patients as metabolic responders and non-metabolic responders: if the decline in SUVmax were >50% or <50%, respectively. Moreover, TTP and overall survival (OS) were assessed and defined as the time from the start of treatment to the evidence of progressive disease and all-causes of mortality, respectively. Death was confirmed by review of death certificate, hospital chart or physician’s records.
Statistical analysis
Data were expressed as median and interquartile range(s) (IQR). The change in FCH uptake for each treatment interval was measured as the change in SUVmax and SUVavg of the index lesions. Continuous variables were compared by using the Kolmogorov Smirnov Z test and the Kruskal-Wallis test for K independent variables, as appropriate. Linear regression analysis was used to test the relation between ΔPSA and ΔPSA. The association between the change in SUV of the index lesion and the subjective category of clinical response (regression, stable disease, or progression) were assessed by using the Kendall rank correlation coefficient (Tau_b). K statistics were used to determine the level of concordance of clinical, PSA and PET/CT responses. K value of >0.4, >0.6, and >0.8 indicate fair, good and excellent agreement, respectively. A two-side analysis was used and p<0.05 value was considered statistically significant (SPSS Inc., Advanced Models 20.0, Chicago, Illinois).
Results
There were 21 eligible patients who underwent 55 PET/CT scans, (8 had only 2 scans while 13 had more than two scans). In Table 1 are reported the characteristics of the study population. The median age was 73 years (range: 58-84 years). The majority of patients were treated by radical prostatectomy and lymph node dissection (n=9; 42.9%), followed or not by adjuvant radiotherapy. The median time from the commencement of the LH-RH analogue and mCRPCa phase was 39.5 months (IQR: 27.25-53 months).
Table 1. Characteristics of patients.
A=not available; RP: radical prostatectomy; LAD: lymphadenectomy dissection; EBRT: external beam radiotherapy; HT: hormone therapy
In 18 of the subjects, the Gleason score was more often ≥7 (n=15; 83.3%). The interval between PET scans ranged from 3 to 11 months, with an average of 5 months between scans. Of 21 patients, 9 (42.9%) had scans 5 or fewer months apart, and the residual 12 (57.1%) had scans 6 or more months apart. Among patients with shorter intervals between FCH PET/CT scans compared to those with longer intervals there was no difference in FCH uptake at baseline (p=0.153), nor in percentage change in SUVmax (p=0.822). Figure 1 and Figure 2 show two representative examples of FCH-PET/CT images.
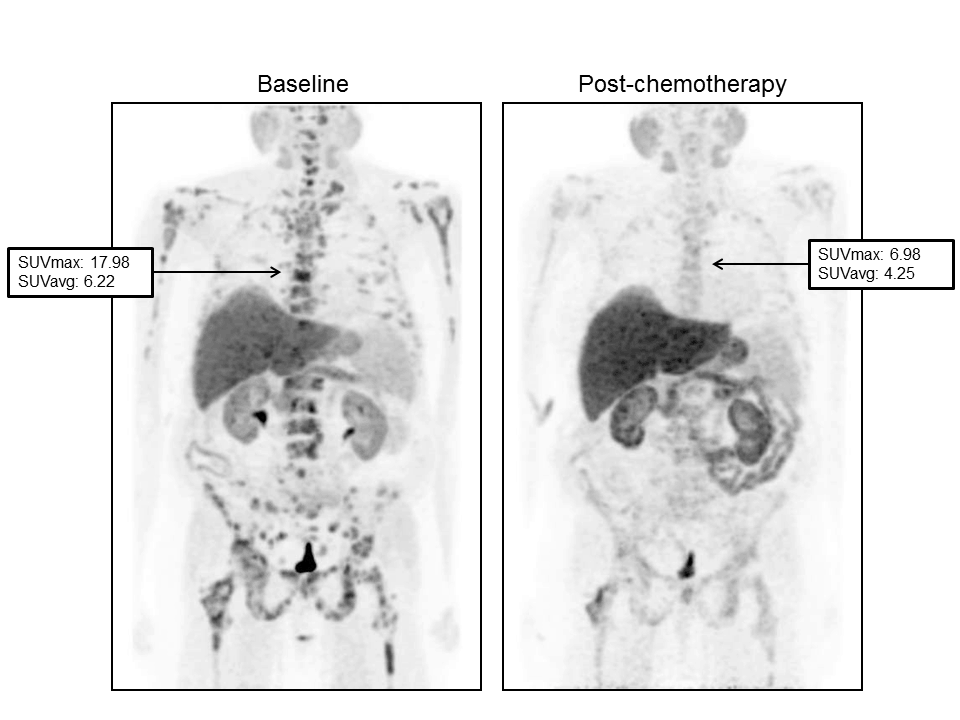
Figure 1. Serial FCH-PET in a 61-year-old patient with response to Abiraterone. (Left) baseline scan obtained in June 2011. PSA value was 1040 ng/mL. Maximum and average standardized uptake values (SUVmax and SUVavg) were 17.98 and 6.22, respectively in the 6th dorsal vertebral. (Right) Scan obtained in September 2011 after 3 months of treatment. PSA value was 1699 ng/mL while a significant reduction in SUVmax and SUVavg (6.98 and 4.25, respectively) was registered.
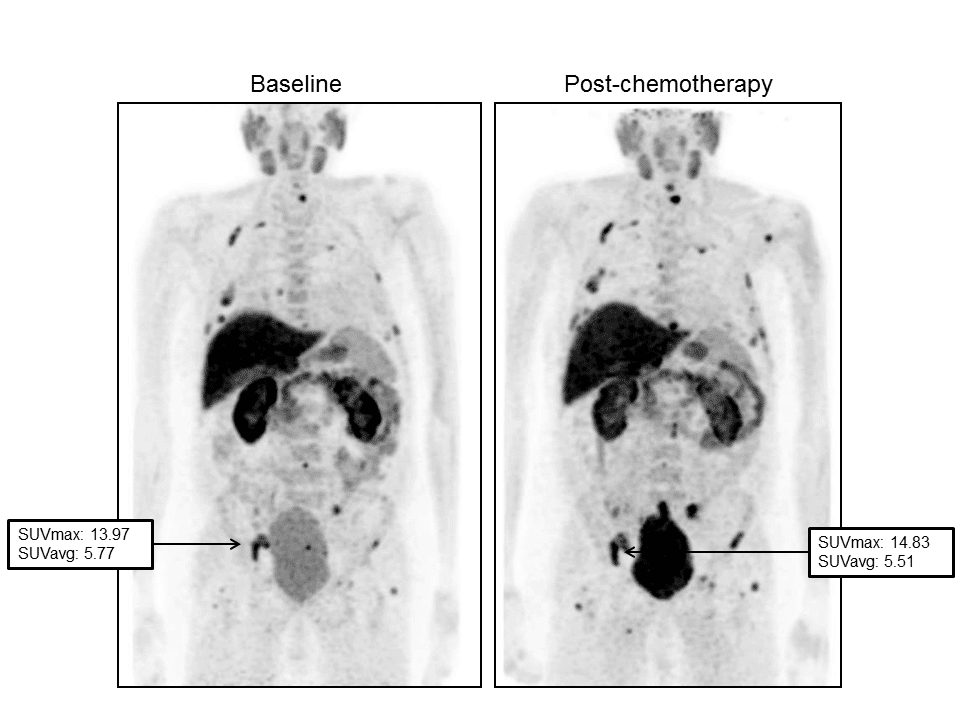
Figure 2. Images demonstrated a progression of disease during Docetaxel. Baseline FCH-PET (left) demonstrated a significant tracer uptake in bones. The maximum standardized uptake value (SUVmax) was 13.97 in right ischium. PSA value was 35 ng/mL. After 7 months from the start of chemotherapy, a second PET scan (right) reported a slight increase in FCH in the same skeletal region (SUVmax: 14.83) and in other sites. PSA value increased to 117.30 ng/mL.
Correlation among change in prostate specific antigen (PSA), in SUVs and response to therapy
Median PSA value and SUVmax of the index lesion were 25 (IQR 7.22-141) ng/mL, 15.7 (IQR 11.3-17.83), 22.9 (IQR 7.7-92.5) ng/mL and 5.5 (IQR 7.21-19.1) ng/mL respectively at the time of baseline and 2nd PET/CT scan. The median ΔPSA and ΔSUVmax were 49.9% and 8.3%, respectively. No correlation between ΔPSA and ΔSUVmax was found (r=0.046; p=0.843). A decrease of PSA>50% and of SUVmax>50% between two PET/CT scans agreed in only 2 patients, while 11 patients showed both a decrease in PSAand in SUVmax <50%.
In accordance with the clinical assessment, 8 (38%) patients were responders, 4 (19%) had a stable and 9 (43%) a progressive disease. The concordance between clinical response (response vs. no response) and PSA (<50% vs. >50%) and between clinical response (response vs. no response) and SUVmax (<50% vs. >50%) were found in 12/21 (57%) and in 16/21 (76%), respectively (K value: 0.087±SE 0.209; p=0.676 and 0.493±SE 0.187; p=0.018).
The median changes in PSA level were 22.3%, -68.5% and -49.9%, respectively for partial response, stable and progressive disease (p=0.685). Conversely, the median changes of SUVmax in the index lesion were significantly different among three categories (52.8%, -10.4% and -12.2%, respectively; p<0.001) (Table 2).
Table 2. Correlation between change in biochemical-semiquantitative data and response to therapy.
The values are expressed as median (minimum; maximum); LN= lymph node; *available in 6 patients; available in 5 patients; †available in 2 patients; ††available in 3 patients.
Moreover, also the changes in SUVmax of bone and lymph node index lesions were significantly different among the subsets of patients. As illustrated in Figure 3, a significant overlap was reported for ΔPSA and clinical categories of response. On the other hand, ΔSUVmax was significantly different in patients with a partial response to chemotherapy as compared to those with stable and progressive disease (p=0.005), although stable and progressive disease patients showed a similar ΔSUVmax (p=0.940).
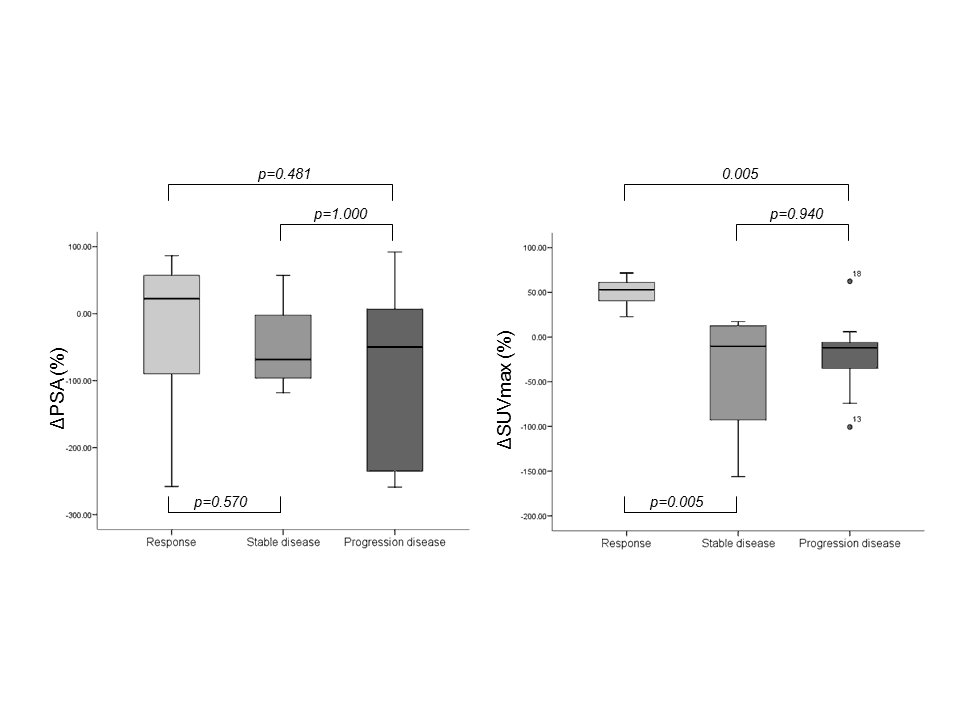
Figure 3. Charts showed the relationships between clinical response and change in PSA value (left) and between clinical response and change in SUVmax (right).
Three out of 21 patients treated with abiraterone acetate showed a partial (n=1), stable (n=1) and progressive response (n=1). Conversely, 7 (38.9%) patients who underwent taxane-based treatment showed a partial response, 3 (16.7%) had a stable disease and 8 (44.4%) had a progression of disease. In these latter subsets of patients, ΔSUVmax resulted more accurately than ΔPSA in defining the clinical response to therapy (p=0.012 and p=0.420, respectively; see Figure 5, Table 1 and Figure 1).
Outcome measures
Median time to progression disease time was 12 months from the time of the start of treatment (range 5–33 months). Eleven patients (52.4%) experienced clinical progression. No differences among ΔSUVmax, ΔPSA and long-term progressive disease were found (all p>0.05). After 16 months (IQR 12-24) from the start of treatment and 108 months (IQR 78-150) from the initial diagnosis, 3 patients died. As illustrated in Table 3, both the changes in PSA and in SUVmax were lower in progressive and dead patients as compared to the counterpart, although not statistically significant.
Progressive disease Survival
No (n= 10) Yes (n= 11) P value Alive (n= 18) Dead (n=3) P value
Change PSA (%) 20.9 (-235; 91.9) -75 (-258.9; 80) 0.271 -26.8 (-258.9; 91.9) -115.1 (-258.1; 80) 0.832
Change SUVmax bone (%) -6.2 (-156.3 37.6)* 52.5 (-74.3; 72.5)** 0.115 21.8 (-156.3;72.5)†† -15.3 (-74.3; 43.6) 0.927
Change SUVavg bone (%) 4.5 (-35.7; 30.7)* 22.3 (-56.4; 51.7)** 0.234 16.2 (-35.7 51.7)†† -17 (-56.4; 22.3) 0.785
Change SUVmax LN (%) 17.2 (-69.4;61.1)* 41.2 (-100.6; 77.3)† 0.425 21.5 (-69.4; 77.3)††
Change SUVavg LN (%) 0.4 (-20.8; 25.2)* 24.7 (-36.3; 58.6)† 0.425 17.1 (-24.7; 58.6)††
Change SUVmax (%) 7.1 (-156.3; 61.1) 43.6 (-110.6; 71.6) 0.250 2.6 (-12.2; 17.4) -74.2 (-100.6; 43.6) 0.292
Change SUVavg (%) 4.7 (-35.7; 30.7) 19.8 (-56.4; 41.9) 0.559 6.7 (4.9-8.3) -36.2 (-56.4; 22.3) 0.203
Table 3. Correlations among change in biochemical-semiquantitative data, progression of disease and survival.
The values are expressed as median (minimum; maximum); LN: lymph node;*available in 5 patients;**available in 9 patients; †available in 8 patients; ††available in 12 patients.
Figure 4 illustrates the distribution of ΔPSA and ΔSUVmax in accordance with the progression and survival of patients. Finally, we found that 100% vs. 67%, and 55% vs. 82% of patients with a decrease of SUV<50% vs. PSA<50%, respectively, showed both a low survival and low TTP period.
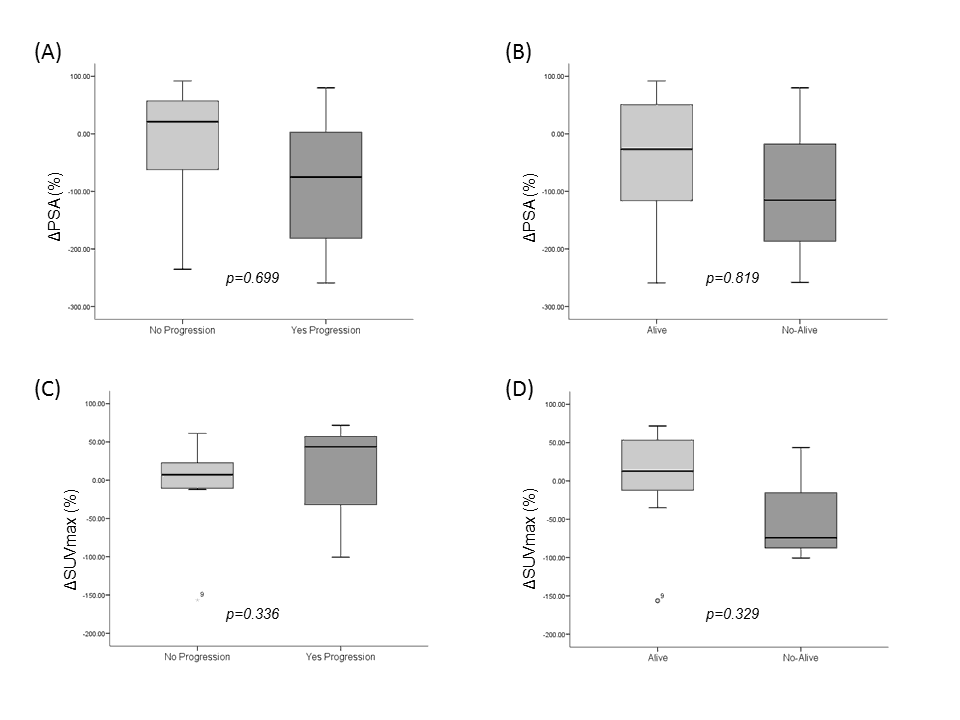
Figure 4. Charts showed the relationships between progression and change in PSA value (A), survival and change in PSA value (B), progression and change in SUVmax (C) and survival and change in SUVmax (D).
Discussion
Over the past 15 years, substantial progress has been achieved in the treatment of patients with mCRPCa with chemotherapy. Primary androgen deprivation therapy is the standard of care, usually with a long-lasting release formulation of LHRH analogue or antagonist [14]. Throughout these years, many patients developed a mCRPCa which progressed despite castrate level of testosterone [15]. Metastatic CRPCa consists in a heterogeneous population of patients.
Various prognostic factors have been suggested, including general prognostic factors, such as pain, ECOG score, Gleason score or biological information, which still needs to be confirmed in larger trials [1]. PSA response – defined as a decrease in serum PSA of >50% for at least 4 weeks – has been proposed as a surrogate marker for radiological and clinical progression [16]. A serum PSA is much simpler to obtain than traditional measurements of treatment outcome and can also be obtained more frequently. It should be noted, however, that PSA responses have not been validated as surrogates for OS in advanced prostate cancer [17]. In the present preliminary study, we aimed to demonstrate that serial FCH-PET/CT correlate with therapeutic response as assessed by PSA value, symptoms and conventional imaging. In our retrospective cohort, the change in SUVmax was more accurate in differentiating a partial response from stable and progressive disease as compared to a change in PSA during or after chemotherapy.
During cytotoxic treatments, the decline of PSA reflects a significant cell kill in response to agents that cause a reduction in the overall tumor burden. Therefore, in the case of an absent decline of PSA during this type of treatment, the drug is considered inactive. In an Editorial published in 2008, Collette [21] reported that the non-cytotoxic drugs could induce changes in PSA that may not be reflected by similar changes in the tumor. Therefore, similarly to PSA, the evaluation of response by 18F or 11C-choline PET/CT could be different in patients who are treated by cytotoxic or non-cytotoxic drugs. Herein, we found that, during cytotoxic treatment, ΔSUVmax is more accurate than ΔPSA in distinguishing patients with a partial response to therapy from those with stable or progressive disease. In fact, the concordance between clinical response to therapy was good for the absolute change of SUVmax (K=0.493; p=0.018), but it resulted fair (K=0.087; p=0.209) or the change of PSA lower of upper 50%.
Moreover, we confirmed the same results also in patients who were treated by taxane-based chemotherapy alone (see Figure 5).
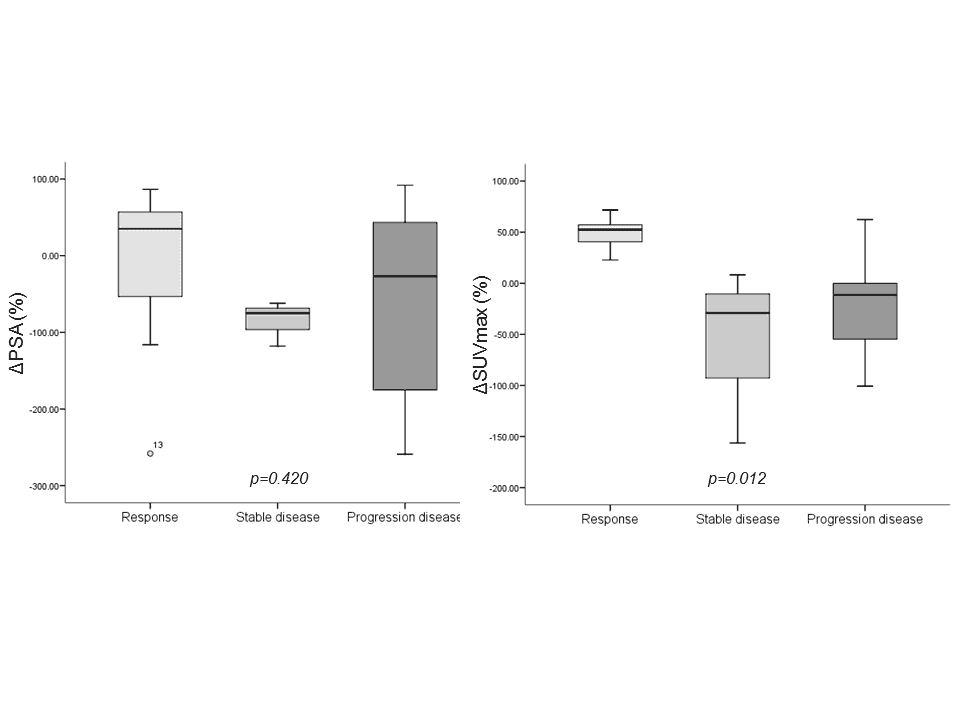
Figure 5. Charts showed the relationships between the response to treatments and the change in PSA value (left) and change in SUVmax (right).
Pantaleo et al [8] examined a clinical case of a patient with metastatic prostate cancer being treated with taxotere and zolendronic acid who underwent 11C-choline PET/CT in the pre and post-therapy setting. The examinations indicated a partial remission of disease which was in accordance with the decreased in serum PSA level, while a total bone scan showed stable disease. The authors stated that the correlation between metabolic activity and serum PSA levels suggests that 11C-choline PET/CT may be more predictive of treatment response than a bone scan in case of bone metastases because it offer more specific data about the metabolic activity of disease and not only about the bone remodeling.
The findings of this study demonstrate the prognostic potential of the changes in SUVs during treatment for the prediction of OS, although both the values were not statistically significant. However, 100% of patients with a decrease in SUVmax>50% resulted in still living still after 16 months from the start of treatment. Giovacchini et al. [22] suggested that 11C-Choline PET/CT might be a suitable technique to identify patients with different prognosis for potential stratification for salvage lymphadenectomy or radiotherapy in oncologic trials. Conversely, Breeuwsma et al. [23] did not find any significant differences in prostate cancer-specific survival on the basis of 11C-choline PET/CT results. In our opinion, and by sharing the results by De Giorgi et al.[9,10], radiolabelled choline PET, either 11C or 18F, might also be useful for monitoring the response to new therapies (such as taxanes or new anti-hormonal agents).Therefore, providing an appropriate support for future clinical trials.
This study’s limitations are typical for a retrospective study. Treatment regimens, duration of treatment intervals, intervals between serial FCH-PET and the use of conventional imaging and tumor markers all varied widely in this patient cohort. Incidentally, the comparison between FCH-PET/CT results and conventional imaging did not represent an end-point of the present study. A bias in selection of patients for inclusion in this analysis was minimized by careful review of consecutive patients referred for FCH-PET/CT imaging and by use of specific inclusion criteria to define a more homogenous group of patients with respect to disease biology and prognosis. The small number of patients in this study as well as insufficient information on assessment of possible change in management represents important study’s limitations. The phenomena of “bone flare”, has already been reported in patients after treatment with abiraterone in chemotherapy-naive mCRPCa who had undergone bone scintigraphy, but that stands out for the first time also with FCH-PET/CT [24]. Three patients who underwent FCH-PET/CT during abiraterone acetate showed a partial response (n=1), a stable disease (n=1) and a progressive disease (n=1) at imaging and also at PSA; however we did not find any flare phenomena in this subset of patients; in particular in the patient with tumor progression (the time between therapy and PET/CT scan was 4 months).
Conclusion
In conclusion, our results suggest that the change in SUVmax, rather than change in PSA, represents an important measure of response to chemotherapy and should be useful to stratify the prognosis of mCRPCa patients. The high cost of a PET/CT scan and the limited available data about the role of 11C/18F-choline PET/CT in the definition of response to therapy requires a comprehensive review and cost-effective studies in order to approve this new indication.
Conflict of interests
The authors confirm that this article content has no conflict of interest.
References
- Heindenreich A, Bastain PJ, Bellmunt J, Bolla M, Joniau S, van der Kwast T, et al. EAU guidelines on prostate cancer. Part I: screening, diagnosis, and local treatment with curative intent update. Eur. Urol. 2014; 65: 124-137.CrossRef PubMed
- Freedland SJ, Presti Jr JC, Amling CL, Kane CJ, Aronson WJ, Dorey F, et al. Time trends in biochemical recurrence after radical prostatectomy: results of the SEARCH database. Urology. 2003; 61: 736-41.CrossRef PubMed
- Kirby M, Hirst C, Crawford ED. Characterizing the castration-resistant prostate cancer population: a systemic review. Int. J. Clin. Pract. 2011; 65: 1180-1192.CrossRef PubMed
- Logothetis CJ, Gallick GE, Maity SN, Kim J, Aparicio A, Efstathiou E, et al. Molecular classification of prostate cancer progression: foundation for marker-driven treatment of prostate cancer. Cancer Discov. 2013; 3: 849-861.CrossRef PubMed
- Basch E, Loblaw DA, Oliver TK, Carducci M, Chen RC, Frame JN, et al. Systemic Therapy in Men With Metastic Castration-Resistant Prostate Cancer: American Society of Clinical Oncology and Cancer Care Ontario Clinical Practice Guideline. J. Clin. Oncol. 2014; 32: 3436-48.CrossRef PubMed
- Humm JL, Sartor O, Parker C, Bruland OS, Macklis R. Radium-223 in the Treatment of Osteoblastic Metastases: A Critical Clinical Review. Int. J. Radiation Oncol. Biol. Phys. 2015; 91: 898-906.CrossRef PubMed
- Al Saeedi F, Smith T, Welch A. (Methyl-3H)-choline incorporation into MCF-7 cells: correlation with proliferation, choline kinase and phospholipase D assay. Anticancer Res. 2007; 27: 901-906.PubMed
- Pantaleo MA, Nannini M, Lopci E, Castellucci P, Maleddu A, Lodi F, et al. Molecular imaging and targeted therapies in oncology: new concepts in treatment response assessment. A collection of cases. Int. J. Oncol. 2008; 33: 443-452.PubMed
- De Giorgi U, Caroli P, Burgio SL, Menna C, Conteduca V, Bianchi E, et al. Early outcome prediction on 18F-fluorocholine PET/CT in metastatic castration-resitant prostate cancer patients treated with abiraterone. Oncotarget. 2014; 5: 12448-12458.CrossRef PubMed
- De Giorgi U, Caroli P, Scarpi E, Conteduca V, Burgio SL, Menna C, et al. 18F-Fluorocholine PET/CT for early response assessment in patients with metastatic castration-resistant prostate cancer treated with enzalutamide. Eur. J. Nucl. Med. Mol. Imaging. 2015; 42(8): 1276-1283.CrossRef PubMed
- Horwich A, Hugosson J, de Reijke T, Wiegel T, Fizazi K, Kataja V, et al. and Panel MembersProstate cancer: ESMO Consensus Conference Guidelines 2012. Annals of Oncology. 2013; 24: 1141-1162.CrossRef PubMed
- Horwich A, Parker C, de Reijke T, Kataja V. ESMO Guidelines Working Group. Prostate cancer: ESMO Clinical Practice Guidelines for diagnosis, treatment and follow-up. Annals of Oncology. 2013; 24: vi106–vi114.CrossRef PubMed
- Scher HI, Halabi S, Tannock I, Morris M, Sternberg CN, Carducci MA, et al. Prostate Cancer Clinical Trials Working Group.: Design and end points of clinical trials for patients with progressive prostate cancer and castrate levels of testosterone: recommendations of the Prostate Cancer Clinical Trials Working Group. J. Clin. Oncol. 2008; 26: 1148-1159.CrossRef PubMed
- Pagliarulo V, Bracarda S, Eisenberger MA, Mottet N, Schröder FH, Sternberg CN, et al. Contemporary role of androgen deprivation therapy for prostate cancer. Eur. Urol. 2012; 61: 11-25.CrossRef PubMed
- Basch EM, Somerfield MR, Beer TM, Carducci MA, Higano CS, Hussain MH, et al American Society of Clinical Oncology endorsement of the Cancer Care Ontario Practice Guideline on nonhormonal therapy for men with metastatic hormone-refractory (castration-resistant) prostate cancer. J. Clin. Oncol. 2007; 25: 5313-5318.CrossRef PubMed
- Bubley GJ, Carducci M, Dahut W, Dawson N, Daliani D, Eisenberger M, et al. Eligibility and response guidelines for phase II clinical trials in androgen-independent prostate cancer: recommendations from the Prostate-Specific Antigen Working Group. J. Clin. Oncol. 1999; 17: 3461-3467.CrossRef PubMed
- Collette L, Buzykowski T, Carroll KJ, Newling D, Morris T, Schorder FH. Is prostate-specific antigen a valid surrogate end point for survival in hormonally treated patients with metastatic prostate cancer? Joint research of the European Organisation for Reaserach and Treatment of Cancer, the Limburgs Universitair Centrum, and AstraZenega Pharmaceuticals. J. Clin. Oncol. 2005; 23: 6139-6148.CrossRef PubMed
- Ramiah V, George DJ, Armstrong AJ. Clinical endpoints for drug development in prostate cancer. Curr. Opin. Urol. 2008; 18: 303-308.CrossRef PubMed
- Dahut WL, Scripture C, Posadas E, Jain L, Gulley JL, Arlen PM, et al. A phase II clinical trial of sorafenib in androgen-independent prostate cancer. Clin. Cancer Res. 2008; 14: 209-214.CrossRef PubMed
- Dror Michaelson M, Regan MM, Oh WK, Kaufman DS, Olivier K, Michaelson SZ, et al. Phase II study of sunitinib in men with advanced prostate cancer. Ann. Oncol. 2009; 20: 913–920.CrossRef PubMed
- Collette L. Prostate-specific antigen (PSA) as a surrogate end point for survival in prostate cancer clinical trials. Eur. Urol. 2008; 53: 6-9.CrossRef PubMed
- Giovacchini G, Picchio M, Garcia-Parra R, Briganti A, Abdollah F, Gianolli L, et al. 11C-Choline PET/CT predicts prostate cancer-specific survival in patients with biochemical failure during androgen-deprivation therapy. J. Nucl. Med. 2014; 55: 233-241.CrossRef PubMed
- Breeuwsma AJ, Rybalov M, Leliveld AM, Pruim J, de Jong IJ. Correlation of (11C)-choline PET/CT with time to treatment and disease-specific survival in men with recurrent prostate cancer after radical prostatectomy. Q. J. Nucl. Med. Mol. Imaging. 2012;56: 440-446.PubMed
- Ryan CJ, Shah S, Efstathiou E, Smith MR, Taplin ME, Bubley GJ, et al. Phase II study of abiraterone acetate in chemotherapy-naive metastatic castration-resistant prostate cancer displaying bone flare discordant with serologic response. Clin. Cancer Res. 2011; 17: 4854-4861.CrossRef PubMed
Article information
Corresponding author: Laura Evangelista.
Copyright: © 2018 Evangelista L, et al.
How to cite: Evangelista L, Maruzzo M, Basso U et al. Can serial FCH-PET/CT scans predict the response to treatments in castrate resistant prostate cancer? J. Diagn Imaging Ther. 2018; 5(1): 20-28 (https://dx.doi.org/10.17229/jdit.2018-0303-032).
Article history: Received 29 January 2018; Accepted 26 February 2018; Published online 03 March 2018.
Archive link: JDIT-2018-0303-032
home »