REVIEW ARTICLE
Simon G. Patching
University of Leeds, Leeds, LS2 9JT, UK
Abstract
The facilitative glucose transport protein GLUT1 has important roles in positron emission tomography (PET) imaging of human diseases. GLUT1 has widespread expression and catalyses the energy-independent facilitated diffusion of glucose down its concentration gradient across red blood cell membranes, blood-brain and blood-tissue barriers and membranes of some oragnelles. Import is usually the prevailing direction of transport for providing metabolic fuel, especially in proliferating cells. PET imaging using 2-deoxy-2-[18F]fluoro-D-glucose ([18F]FDG) measures the uptake of [18F]FDG into cells and tissues as a marker of glucose transport and glycolytic activity. Diseases can alter glycolytic activity in localised regions of tissues or organs, which can be visualised using [18F]FDG PET. Expression and/or activity levels of GLUT1 contribute to the pattern and intensity of [18F]FDG. [18F]FDG PET imaging is used in diagnosing and monitoring a range of human diseases and in analysing their response to treatments. Proliferating cancer cells display overexpression of GLUT1 and a vastly higher rate of glycolysis for satisfying their increased nutrient demands. Tumours, therefore, have significantly enhanced [18F]FDG uptake compared with normal cells, so [18F]FDG PET is routinely used in diagnosing and monitoring cancers. [18F]FDG PET imaging of the brain allows identification of distinct patterns of hypometabolism and/or hypermetabolism associated with neurological disorders including Alzheimer’s disease, Parkinson’s disease, epilepsy, schizophrenia, multiple sclerosis and cerebral ischemia. Cardiovascular diseases, along with underlying conditions such as inflammation, sarcoidosis, atherosclerosis, and infections of implants and prosthetics are routinely assessed using [18F]FDG PET. Diabetes alters the distribution of [18F]FDG, which can affect the diagnosis of other diseases. The effects of anti-diabetic drugs on glucose metabolism and activation of brown adipose tissue as a preventative measure or treatment for obesity and diabetes have been investigated using [18F]FDG PET. GLUT1 itself is a potential therapeutic target for treatment of some diseases, which has also been investigated using [18F]FDG PET.
Keywords: cancer; cardiovascular disease; diabetes; FDG-PET imaging; glucose metabolism; GLUT1; neurological disorders; positron emission tomography; radiochemistry; transport protein
1. Introduction
1.1. GLUT facilitative transport proteins
Glucose homeostasis in the human body is maintained by the GLUT or solute carrier 2 (SLC2) family of facilitative transport proteins, which are members of the sugar porter sub-family of the large and widespread Major Facilitator Superfamily (MFS) of secondary transport proteins [1,2,3]. GLUT proteins catalyse the energy-independent facilitated diffusion of hydrophilic glucose molecules and other substrates down their concentration gradient across hydrophobic cell membranes. Import is usually the prevailing direction of transport in order to provide metabolic fuel, especially in proliferating cells (Figure 1A). Fourteen GLUT isoforms (GLUT1-14) have been identified that are each comprised of ~ 500 amino acid residues. These share a high sequence similarity (19-65% identity, 39-81% homology) [4] and a number of structural features including twelve putative transmembrane-spanning α-helices arranged in two distinct N- and C-terminal domains of six helices, cytoplasmic N- and C-terminal ends, a large intracellular loop between helices 6 and 7 and a single-site of N-linked glycosylation on one of the extracellular loops. The different isoforms have different patterns of tissue-specific expression, cellular localisation, substrate specificity and kinetics, which can be altered under disease conditions. Details and physiologies of the fourteen GLUT isoforms have been reviewed extensively [5–13].
1.2. Glucose transporter GLUT1
GLUT1 was the first equilibrative glucose transporter to be identified, purified and cloned [14–17] and has become one of the most extensively studied of all membrane transport proteins. Hexose and pentose sugars that adopt a pyranose conformation are the preferred substrates of GLUT1 [18], which recognises D-glucose in both its α- and β-pyranose forms with equal affinity [19], but it does not recognise L-glucose. Some glucose analogues including 2-deoxy-D-glucose and 3-O-methyl-D-glucose (Figure 1B) are transported by GLUT1 and have been used as tools in metabolic and kinetic transport experiments. On entering the cell 2-deoxy-D-glucose is phosphorylated by hexokinase to give 2-deoxy-D-glucose-6-phosphate, which is not metabolised any further and is not transported by GLUT1 so it becomes trapped inside the cell [20], whilst 3-O-methyl-D-glucose is not phosphorylated by hexokinase [21]. When examined in Xenopus laevis oocytes, GLUT1 transports D-glucose with an apparent affinity (Kmapp value) of 3 mM, whilst values for transport of 2-deoxy-D-glucose and 3-O-methyl-D-glucose have been measured at 5 mM and 17-26 mM, respectively, in the same system [22–25]. In the erythrocyte membrane, the apparent Km value for glucose uptake has been measured at around 1.5 mM and when reconstituted in liposomes at 1-2 mM [26–28]. Other hexoses transported by GLUT1 include galactose, mannose, and glucosamine and GLUT1 also transports the oxidized form of vitamin C, dehydroascorbic acid, in order to confer mitochondrial protection against oxidative injury [29]. The transport activity of GLUT1 is inhibited by a number of different compounds including cytochalasin B, forskolin, phloretin and other flavonoids, maltose and mercuric chloride, which all have low micromolar affinities [30–34] and these have been used in a range of experimental studies of GLUT1 sugar transport and function.
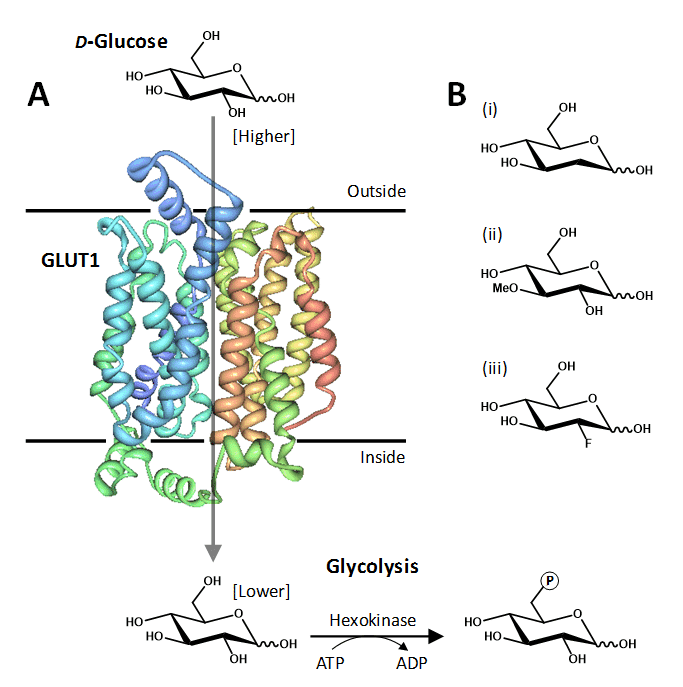
Figure 1. The human facilitative glucose transport protein GLUT1. A. Crystal structure of GLUT1 illustrated in a cell membrane catalysing the inward movement of D-glucose down its concentration gradient. The transported glucose is metabolised by the glycolytic pathway, the first step being conversion to glucose-6-phosphate catalysed by hexokinase. The structure of GLUT1 is coloured with the N-terminus in blue and the C-terminus in red, which was drawn using PDB file 4PYP and PDB Protein Workshop 3.9 [35]. B. Examples of transported glucose analogues: (i) 2-deoxy-D-glucose; (ii) 3-O-methyl-D-glucose; (iii) 2-deoxy-2-fluoro-D-glucose (FDG).
Much of the exploratory mutational analysis, topology predictions and structural modelling of GLUT1, and of other GLUTs, has been superceded by a recent X-ray crystal structure of human GLUT1 at 3.2 Å resolution in an inward-open conformation (PDB 4PYP) [36]. The structure constitutes an overall MFS and predicted GLUT protein fold but also has an intracellular helical bundle comprised of four short α-helices that connects the N- and C-terminal domains (Figure 1A). This intracellular helical bundle was also seen in structures of the homologous proton-coupled active bacterial sugar porter proteins XylE [37] and GlcP [4]. The structure of GLUT1 has allowed an accurate mapping of disease-associated mutations and provided further insight into the alternating access mechanism of transport in GLUT proteins and its relation to the transport mechanism in homologous active sugar porters [36].
1.3. GLUT1 in human health and disease
The importance of GLUT1 in the development and maintenance of a healthy human cannot be overemphasised. Firstly, it is the ubiquitous glucose transporter thought to be constitutively expressed and responsible for basal glucose uptake to sustain respiration in most cells throughout the body and its level of expression is usually correlated with the rate of glucose metabolism and respiration [7,8]. GLUT1 is expressed at the highest levels in the developing embryo, in the plasma membranes of erythrocytes and at the blood-brain barrier, but also in cardiomyocytes, adipocytes and smooth muscle cells, at endothelial and epithelial blood-tissue barriers, and intracellularly within the endoplasmic reticulum, Golgi apparatus and endosomes [9,38–44]. In erythrocytes GLUT1 is the only significant isoform of expressed GLUT protein with over 200,000 molecules per cell [16,45], constituting up to 3-5% of all proteins [10] and 10-20% of integral membrane proteins [46]. This high level of expression enabled GLUT1 to be the only GLUT protein purified from its native cell type [14,47,48].
Because the human brain is almost entirely dependent upon glucose as an energy source, taking in ~100-150 g of glucose per day [49], and GLUT1 is unique in mediating glucose transfer across the blood-brain barrier, GLUT1 is essential for maintaining normal neurological functions. Given the widespread distribution of GLUT1 and its highly important roles, it is clear that anything affecting the normal expression or functioning of GLUT1 can have severe consequences on human health. A prime example is the relatively recently recognised GLUT1-deficiency syndrome [50], which results from mutations in the gene that expresses GLUT1. An impaired function of the GLUT1 protein reduces the amount of glucose available to brain cells affecting brain development and function. The condition is usually inherited in an autosomal dominant manner and neurological problems present in young children, including, difficulties in movement and speech and delay in development and intellectual disability [51–57]. GLUT1 defects are also increasingly being recognised as the cause of some genetic generalised epilepsies and other neurological disorders including early-onset absence epilepsy [58,59], familial idiopathic generalized epilepsy [60] and paroxysmal exercise-induced dyskinesia [61,62].
GLUT1 is highly overexpressed in many types of cancer cells [63] including brain [64], breast [65], cervical [66], colorectal [67], cutaneous [68], endometrial [69], esophageal [70], hepatic [71], lung [72], oral [73], ovarian [74], pancreatic [75], prostate [76] and renal [77]. Because cancer cells have an altered metabolism and an increased demand for nutrients they usually show an upregulation of GLUT1 in order to provide an enhanced uptake of glucose in correlation with a greater rate of glycolysis. This is accompanied by an increase in rate-limiting enzymes of the glycolytic pathway including hexokinase [78,79]. The ability of rapidly dividing tumour cells to break down glucose by glycolysis at a vastly higher rate than in normal tissues, even when ample oxygen is present, is known as the Warburg effect [80–85]. Under these ‘aerobic glycolysis’ conditions most glucose is converted to lactate rather than being metabolised through oxidative phosphorylation so a high rate of glucose uptake is required to sustain energy levels for tumour growth. The levels of GLUT1 expression and glucose uptake are therefore prognostic and diagnostic markers for the growth of tumours. Measuring uptake of the 18F-labelled glucose analogue radiotracer 2-deoxy-2-fluoro-D-glucose ([18F]FDG) (Figure 1B) into tissues using positron emission tomography (PET) imaging is the most common method for identifying and monitoring tumours in patients. Intravenous injection of [18F]FDG is followed by PET scanning to provide two- or three-dimensional images for the distribution of 18F-FDG within the body. GLUT1 clearly plays a pivotal role in defining the distribution of 18F-FDG using this important clinical tool. This review article considers the roles that GLUT1 plays in [18F]FDG PET imaging of cancers and also of neurological disorders, cardiovascular diseases and under diabetic conditions. GLUT1 itself is also a potential therapeutic target for some of these human diseases.
2. PET imaging using 2-deoxy-2-[18F]fluoro-D-glucose
Positron emission tomography (PET) is a clinical nuclear medicine technique that reflects tissue physiology and metabolism in two- or three-dimensional images of the body. This is in contrast to other clinical diagnostic tools such as magnetic resonance imaging (MRI) and x-ray computed tomography (CT), which provide predominantly anatomic information. The PET system detects pairs of gamma rays emitted indirectly by a short-lived positron emitting radionuclide (or radiotracer), which is introduced into the body on a biologically active molecule. The stages involved in PET imaging of a human body are illustrated in Figure 2. Due to the short-lived nature of the gamma-emitting radionuclides (11C – 20 minutes, 13N – 10 minutes, 15O – 2 minutes, 18F – 110 minutes), the sites of the cyclotron, radiosynthesis and PET scanner are often in relative close proximity of each other and coordinated alongside interaction with the patient. The longer-lived 18F isotope can be transported to more remote locations, however.
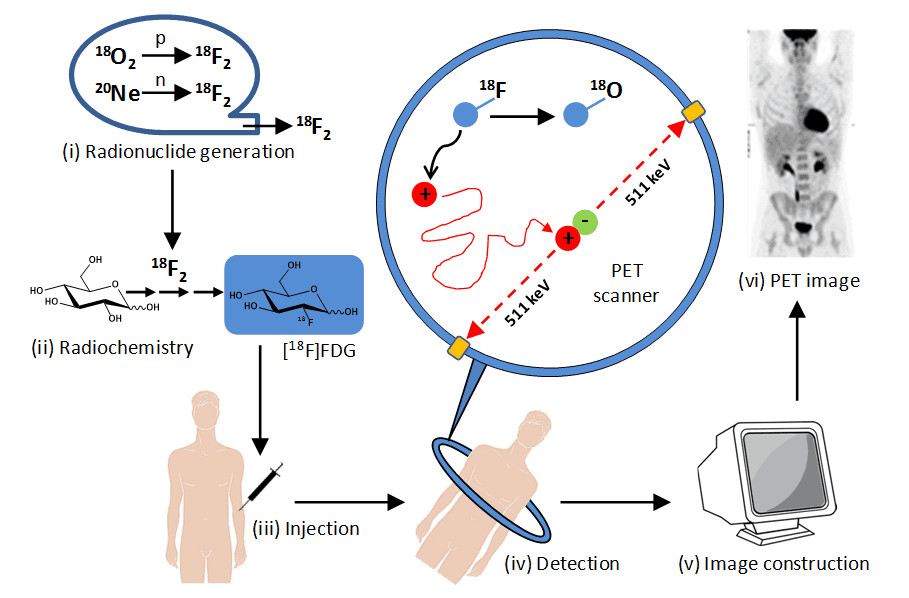
Figure 2. Stages in PET imaging of the human body. (i) Radionuclide generation. A positron-emitting radionuclide with a short half-life is made using a particle accelerator (cyclotron), e.g. fluorine-18 (half-life 110 minutes) is produced by proton bombardment of oxygen-18 or deuteron bombardment of neon-20. (ii) Synthesis of radiolabelled bioactive molecule. The cyclotron-generated radionuclide is incorporated into a bioactive molecule or drug compound, e.g. synthesis of 2-deoxy-2-[18F]fluoro-D-glucose ([18F]FDG) using fluorine-18. (iii) Injection into a patient. The radiolabelled compound is injected into the bloodstream, often under fasting conditions, followed by a waiting period (usually 1 hour for [18F]FDG) allowing it to spread to body tissues. (iv) Detection of gamma (annihilation) photons. A positron emitted from the radiolabelled compound travels in tissue a short distance (typically less than 1 mm) and on encountering an electron there is an annihilation event where their combined mass is converted into two high energy (511 KeV) gamma photons emitted approximately 180º apart, which are detected by the scanning array that surrounds the patient. The simultaneous detection of two emissions (coincidences) approximately opposite each allows the identification of a line of response between the two detectors along which the decay event occurred (those that do not arrive within a few nanoseconds of each other are ignored). (v) Image construction. Mathematical equations and computing are used to define the locations of hundreds of thousands of coincidence events from a scanning session. These are used to generate a two- or three-dimensional image for the distribution of the radiolabelled compound in body tissues. (vi) Normal [18F]FDG PET image. This PET image (reproduced from http://www.rah.sa.gov.au/nucmed/PET/pet_docguide.htm, © 1997-2009, Nuclear Medicine, PET & Bone Densitometry, Royal Adelaide Hospital) shows the distribution of [18F]FDG in a healthy individual. The PET image can be combined with images from MRI and/or CT scans.
By far the most common and successful radiolabelled compound used in PET imaging is [18F]FDG, which is used in over 95% of PET procedures worldwide [86]. This compound was first synthesised by the direct electrophilic fluorination of 3,4,6-tri-O-acetyl-D-glucal with 18F-fluorine gas [87] (Figure 3A), but this method and its variations have a relatively low radiochemical yield. The preferred method for synthesising [18F]FDG in PET applications is nucleophilic substitution of the acetylated sugar derivative 1,3,4,6-tetra-O-acetyl-2-O-trifluoromethane-sulfonyl-β-D-mannopyranose by 18F-fluoride ions using Kryptofix 2.2.2TM as a catalyst followed by separation of reaction products and hydrolysis [88] (Figure 3A). This method gives higher radiochemical yields (up to 60%) in a shorter time with modern automated synthesis modules producing [18F]FDG in under half an hour. The methods for synthesis of [18F]FDG and associated quality control considerations have been reviewed [89–91]. The only difference in chemical structure between [18F]FDG and glucose is a fluorine atom attached at carbon-2 instead of a hydroxyl group (Figure 1), so when injected into the body [18F]FDG is transported into cells by GLUT1 (and other sugar transporters) in the same manner as glucose. On entering the cell [18F]FDG is phosphorylated by hexokinase to [18F]FDG-6-phosphate, but unlike glucose, this cannot be metabolised any further by the glycolytic pathway [92] (Figure 3B). [18F]FDG-6-phosphate also cannot cross cell membranes so it becomes trapped and accumulates within the cell. As the 18F label decays radioactively it is converted to 18O–, which picks up a proton from a hydronium ion in the aqueous environment and the molecule becomes glucose-6-phosphate with non-radioactive 18O at the 2-position, which is harmless (Figure 3B). This 18O-labelled glucose-6-phosphate can then be metabolised as normal. In PET studies, [18F]FDG is therefore an excellent marker for the uptake of glucose into specific tissues and of their glycolytic state. A number of other radiofluorinated carbohydrates have also been used in PET studies [93].
In examining PET scans with [18F]FDG it is important to be aware of the distribution of [18F]FDG in a healthy individual before using them to recognise disease states. As would be expected, the highest levels of [18F]FDG accumulation in a normal PET scan are in tissues with the highest expression of GLUT1 and the highest rates of glycolysis, which are principally the brain and cardiac tissue (Figure 2). Normal individuals do not excrete glucose via the urinary system because it is freely filtered by glomeruli and rapidly reabsorbed by the nephron of the kidney. In contrast, [18F]FDG is poorly reabsorbed after filtration and is excreted in large amounts in the urine [86]. Consequently, an intense [18F]FDG activity is usually observed in the kidneys, ureters and bladder (Figure 2). Lower levels of [18F]FDG uptake can also be observed in a number of others tissues in a healthy individual depending on their physiological state [86,94]. This includes a low and diffuse activity in liver and spleen and variable activity in stomach and bowel smooth muscle. Uptake in skeletal muscle is dependent on levels of stress and/or physical activity, so a patient is usually rested prior to and following injection of [18F]FDG. Low uptake in bone marrow produces faint observation of vertebrae, pelvis and ends of humerus and femur. Moderate activity in pharynx, tonsils, salivary glands and vocal chords is often seen and vascular uptake can provide an outline observation of blood vessels.
![Figure 3. Synthesis and metabolism of [18F]FDG during glucose transporter GLUT1](https://openmedscience.com/wp-content/uploads/2015/02/Figure-3.-18FFDG.png)
Figure 3. Synthesis and metabolism of [18F]FDG. A. Synthesis of [18F]FDG by electrophilic fluorination of 3,4,6-tri-O-acetyl-D-glucal by 18F-fluorine gas or by nucleophilic substitution of 1,3,4,6-tetra-O-acetyl-2-O-trifluoromethane-sulfonyl-β-D-mannopyranose by 18F-fluoride ions using Kryptofix 2.2.2TM as a catalyst. B. Metabolism of [18F]FDG following GLUT1-mediated transport into cells. [18F]FDG is phosphorylated by hexokinase to [18F]FDG-6-phosphate, which cannot be metabolised further by glycolysis. The 18F label decays radioactively to 18O–, which picks up a proton and the molecule becomes glucose-6-phosphate. This 18O-labelled glucose-6-phosphate is then metabolised as normal.
PET scans using [18F]FDG can cover the whole body or focus on specific organs or body regions. They can be used to map normal brain and heart function, monitor blood flow to the heart, determine the effects of myocardial infarction on the heart, detect and follow the spread of cancers, monitor cancers during and after treatment, identify and monitor neurological disorders, other cardiovascular diseases and the effects of diabetes. Transport of glucose and [18F]FDG by GLUT1 plays a pivotal role in all of these.
3. GLUT1 in [18F]FDG PET imaging of cancers
3.1. Introduction
PET imaging with [18F]FDG is a routine and essential clinical tool used in the diagnosis and treatment of a wide range of cancers. As already described in the Introduction, this arises from the enhanced uptake of glucose and rate of glycolysis common to all cancer cells, a property that allows them to be distinguished from normal cells. In PET scans [18F]FDG accumulation is used as a marker of glucose uptake and glycolytic activity, which is often correlated with the level of GLUT1 expression. As tumours become more established there is a movement towards hypoxic conditions under which the transcription factor hypoxia-inducible factor-1α (HIF-1α) promotes an even further upregulation in the expression of GLUT1 and of glycolytic enzymes including hexokinase. A high expression of GLUT1 and/or of hexokinase is usually associated with a poor prognosis in many types of cancers [95,96]. There are of course a large number of other metabolic changes that occur in the microenvironment of a tumour [97,98], but these will not be considered here. Changes in metabolic features associated with malignancy often precede the morphologic findings that are demonstrated with anatomic imaging techniques. Importantly, PET imaging using [18F]FDG can be used to detect early changes in the metabolism of cancer cells, which can allow an early prognosis of the disease. This allows an early intervention with appropriate treatments that are more likely to have a successful outcome. Cancers that are further advanced are detected more easily and [18F]FDG scans are also used to monitor progress during treatment and after treatment to look for possible recurrence. Parallel or retrospective measurements of the expression of GLUT1, hexokinase and other biological markers are also performed. It is beyond the scope of this review to include all published results for the PET imaging of cancers using [18F]FDG, so the remainder of this section will consider the roles of GLUT1 in [18F]FDG PET imaging of some common and pertinent cancers and highlight GLUT1 as a potential therapeutic target for cancer treatments.
3.2. Lung cancer
Lung cancer is the most common form of diagnosed malignancy worldwide and it has the highest rate of cancer mortality [99]. [18F]FDG PET imaging is especially useful for investigating non-small cell lung cancer (NSCLC), which accounts for the large majority of lung cancer cases. Viable lung cancer cells show a particularly high accumulation of [18F]FDG compared with normal lung tissue, which assists in making decisions for a clear diagnosis and during the management of tumours [100]. Examples of [18F]FDG PET images of lung cancers are shown in Figure 4.
![Figure 4 shows the [18F]FDG PET imaging of a lung cancer](https://openmedscience.com/wp-content/uploads/2015/02/Figure-4.-18FFDG-PET-of-lung-cancer.png)
Figure 4. [18F]FDG PET imaging of a lung cancer. A. An axial view CT scan reveals a non-specific nodule in the right lung (arrow). B. A [18F]FDG PET scan from the same view as in the CT scan shows an enhanced uptake of [18F]FDG into the nodule (arrow), which was confirmed to be lung cancer. C. In a different patient, a full body [18F]FDG PET scan shows an enhanced uptake of [18F]FDG into a known lung cancer in the left upper lobe (upper arrow) and also into two small ipsilateral mediastinal lymph nodes (arrowheads). This research was originally published in JNMT. Acker MR, Burrell SC. Utility of 18F-FDG PET in evaluating cancers of lung. J Nucl Med Technol. 2005; 33(2): 69-74 [100]. © by the Society of Nuclear Medicine and Molecular Imaging, Inc.
A recent retrospective study on the biological significance of [18F]FDG uptake on PET in patients with NSCLC demonstrated that a high [18F]FDG uptake was significantly associated with poor prognosis. [18F]FDG uptake was significantly correlated with expression of GLUT1, hexokinase I and HIF-1α and also of vascular endothelial growth factor (VEGF), microvessels (CD34), epidermal growth factor receptor (EGFR), and molecules relevant to the PI3K/Akt/mTOR signaling pathway p-Akt and p-mTOR. Furthermore, the uptake of [18F]FDG was significantly decreased by the inhibition of GLUT1 and GLUT1 upregulation by the induction of HIF-1α increased the [18F]FDG uptake, thus confirming their roles in PET imaging of lung cancer [101]. An earlier study had also demonstrated a significant correlation between GLUT1 expression and [18F]FDG uptake in lung cancers, but whilst [18F]FDG uptake correlated significantly with tumour size, GLUT1 expression did not [102]. Lactate dehydrogenase A (LDHA) plays an important role in the development and spread of lung cancers and a separate retrospective study investigated the relationship between [18F]FDG accumulation and LDHA expression. This showed that LDHA increases [18F]FDG accumulation into NSCLC, possibly by upregulation of GLUT1 expression but not hexokinase II expression, so LDHA may modulate [18F]FDG uptake in lung cancers via the AKT-GLUT1 pathway [103]. NSCLC patients that have underlying mutations in the Kirsten RAS (KRAS) oncogene can fail to benefit from adjuvant chemotherapy and their disease does not respond to epidermal growth factor receptor (EGFR) inhibitors such as gefitinib and erlotinib [104]. A retrospective study of NSCLC cases has found a significant correlation between GLUT1 overexpression and KRAS mutations and the survival of patients with GLUT1 overexpression was significantly worse when compared to patients with normal expression of GLUT1. GLUT1 overexpression therefore correlates with this aggressive phenotype of lung cancer [105].
3.3. Breast cancer
Breast cancer has the second highest number of diagnosed malignancies worldwide, although this does not correlate with the number of mortalities since treatments are relatively successful [99]. Alongside other screening techniques, [18F]FDG PET imaging plays an important role in the diagnosis of different types and stages of breast cancers and during their treatment [106–110]. An example of using [18F]FDG PET to diagnose a rare case of breast cancer in a lactating woman is shown in Figure 5.
![Figure 5 shows [18F]FDG PET imaging of a breast cancer](https://openmedscience.com/wp-content/uploads/2015/02/Figure-5.-PET-Imaging-of-breast-cancer.png)
Figure 5. [18F]FDG PET imaging of a breast cancer. Axial views of a CT scan (A), [18F]FDG PET scan (B) and a combined PET/CT scan (C) and a full body [18F]FDG PET scan (D) of a lactating women who presented with a lump in the right breast. The intense uptake of [18F]FDG in the soft tissue lesion in the right breast was confirmed to be breast cancer. This research was originally published in Onc Gas Hep Rep. Kamaleshwaran KK, Natarajan S, Rajan F, Mohanan V, Shinto AS. Image findings of a rare case of gestational breast cancer diagnosed in a lactating woman with fluorine-18 fluorodeoxyglucose-positron emission tomography/computed tomography. Onc Gas Hep Rep. 2014; 3: 34-35 [110]. © by Oncology, Gastroenterology and Hepatology Reports.
Factors that have a major influence on [18F]FDG uptake in breast cancers include expression of GLUT1 and hexokinase I and also the number of viable tumour cells per volume, histological subtype, tumour grading, microvessel density and proliferative activity [111]. An immunohistochemical study of excised early-stage breast carcinomas, which had previously been detected in [18F]FDG PET scans, revealed a significant correlation between [18F]FDG uptake, new blood vessel formation and GLUT1 expression. This confirmed the usefulness of [18F]FDG PET and other biomarkers for detecting angiogenesis in early breast cancer [112]. An investigation of the relevance of single-nucleotide polymorphisms (SNPs) in the GLUT1 gene with respect to uptake of [18F]FDG and tumour aggressiveness in breast cancer revealed a significant role of the XbaI G>T polymorphism [113]. The GLUT1 XbaI G>T SNP, which represents a G-to-T transversion in intron 2 of GLUT1, may therefore be a prognostic factor for the aggressiveness of the phenotype in breast cancers. A significant association between the GLUT1 XbaI G>T SNP and genetic susceptibility to nephropathy in type 1 diabetes has also been identified [114]. The monoclonal antibody trastuzumab used in the treatment of some breast cancers targets HER2 receptors, which are overexpressed in 20-30% of breast cancers. Trastuzumab downregulates signalling through the Akt/PI3K and MAPK pathways that modulate glucose and phospholipid metabolism. Treatment of HER2-expressing breast cancer xenografts with trastuzumab showed a significant decrease in [18F]FDG accumulation and in expression of GLUT1 and hexokinase II. The same study also used 31P NMR to show a parallel decrease in phosphocholine and phosphoethanolamine in chemical extracts in the same xenografts treated with trastuzumab [115].
3.4. Colorectal cancer
Colorectal or bowel cancer has the third highest number of diagnosed malignancies worldwide [99]. [18F]FDG PET plays an important role in the diagnosis and management of colorectal cancers where there is a significant positive correlation between accumulation of [18F]FDG and expression of GLUT1, hexokinase II and HIF-1α [116–118]. In contrast, a correlation between accumulation of [18F]FDG and expression of proliferative cellular nuclear antigen (PCNA) has not been observed suggesting that the overexpression of GLUT1 is associated with the hypoxic environment in tumours rather than with tumour growth [119]. Indeed, GLUT1 has been specifically highlighted as an important molecular marker for the degree of hypoxia experienced by tumours in colorectal cancer patients [120]. A retrospective analysis of colorectal tumours showed that accumulation of [18F]FDG was higher in the presence of KRAS/BRAF gene mutations and this was positively correlated with GLUT1 expression but not with hexokinase II expression [121]. KRAS gene mutations occur in 30-40% of colorectal cancers and are associated with resistance to anti-epidermal growth factor receptor therapy and with a poorer likelihood of survival [122]. In colorectal cancer cells with KRAS mutations the knockdown of GLUT1 produces a significant decrease in accumulation of [18F]FDG. Also, hypoxic induction of HIF-1α is higher in KRAS-mutant cells than in wild-type cells and elevated HIF-1α results in higher GLUT1 expression and accumulation of [18F]FDG [123]. These observations suggest that KRAS mutations produce higher accumulation of [18F]FDG by upregulation of GLUT1 and that HIF-1α further increases accumulation of [18F]FDG in hypoxic lesions. [18F]FDG PET may therefore be useful in predicting the KRAS status of patients with colorectal cancer and help in the design and management of therapeutic strategies [123].
3.5. Prostate cancer
Prostate cancer can be more challenging to image using [18F]FDG PET because glucose utilisation in well-differentiated prostate cancer is often lower than in other tumour types and the normal urinary excretion of [18F]FDG can mask pathological accumulation [124,125]. An enhanced expression of GLUT1 is found in prostate carcinoma cells, which includes a novel co-localisation of GLUT1 with a Golgi marker. This GLUT1 Golgi association may supply glucose to the Golgi for by-product incorporation into the prostatic secretory fluid [76]. For prostate cancer patients treated with radical prostatectomy a significant number will endure a recurrence of the disease. An immunohistochemical study of prostate cancer tissue revealed that expression of GLUT1 correlates significantly with a shorter time to biochemical recurrence and accumulation of prolyl-4-hydroxylases 1 is also a significant marker for a worse prognosis [126]. Whilst early-stage prostate cancer is confined to the prostate and responds to androgens, a later stage more aggressive metastasised cancer is associated with loss of androgen responsiveness. Androgen responsive and non-responsive prostate cancer cells have different glycolytic metabolism profiles, including a higher lactate production by the latter [127]. The flavanoids genistein, phloretin, apigenin, and daidzein have different effects on reducing GLUT1 expression and glucose uptake in androgen responsive versus non-responsive prostate cancer cells and therefore different effects on reducing cell growth [128].
3.6. Thyroid cancer
Thyroid cancers are routinely diagnosed and monitored using [18F]FDG PET imaging [129,130]. An example of enhanced accumulation of [18F]FDG into a thyroid is shown in Figure 6, in this case demonstrating how use of [18F]FDG PET has also reduced the number of unnecessary hemithyroidectomies for thyroid nodules that otherwise have inconclusive cytologic results [131]. An investigation of glucose transporter expression in thyroid carcinomas with different grades of malignancy revealed that overexpression of GLUT1 on the cell membrane of thyroid neoplasms is closely related to tumours at a more aggressive stage. It was therefore proposed that measurement of [18F]FDG uptake and of GLUT1 expression in thyroid cancer tissue may be a useful prognostic in identifying patients at the highest risk [132]. This correlation has been confirmed more recently in a study that demonstrated an increase in GLUT1 expression and [18F]FDG uptake with escalating dedifferentiation/aggressiveness of thyroid carcinoma types in the order: differentiated thyroid carcinoma (DTC) → poorly differentiated thyroid carcinoma (PDTC) → anaplastic thyroid carcinoma (ATC) [133]. The PTEN tumour suppressor is a phosphatase that antagonises the PI3k/Akt signalling pathway and is the second most mutated gene in human cancer [134]. PTEN is frequently mutated or deleted in thyroid cancers, and since GLUT1 expression is under control of the PI3k/Akt pathway, inactivation of PTEN results in amplified expression of GLUT1 and an enhanced uptake of [18F]FDG in PET images [135]. Indeed, recent genetic manipulations of PTEN expression have demonstrated that a lack of PTEN has a dominant effect on the expression of GLUT1 and on glucose uptake. Inactivation of PTEN therefore increases the chance of thyroid cancer detection by [18F]FDG PET [136].
![Figure 6 shows the [18F]FDG PET imaging of a thyroid cancer](https://openmedscience.com/wp-content/uploads/2015/02/Figure-6.-PET-Imaging-of-thyroid-cancer.png)
Figure 6. [18F]FDG PET imaging of a thyroid cancer. Front and side view [18F]FDG PET scans showing enhanced accumulation of [18F]FDG in a thyroid nodule. This research was originally published in JNM. de Geus-Oei LF, Pieters GF, Bonenkamp JJ, Mudde AH, Bleeker-Rovers CP, Corstens FH, et al. 18F-FDG PET reduces unnecessary hemithyroidectomies for thyroid nodules with inconclusive cytologic results. J Nucl Med. 2006; 47(5): 770-775 [131]. © by the Society of Nuclear Medicine and Molecular Imaging, Inc.
3.7. Esophageal cancer
Esophageal cancer has one of the worst levels of prognosis since it is often identified at a relatively late stage [137]. Amongst other techniques, [18F]FDG PET imaging is used in the diagnosis and management of esophageal cancer [138], an example of a [18F]FDG PET image of a patient with a long esophageal tumour is shown in Figure 7. An immuohistochemical evaluation of esophageal cancers showed an expression of GLUT1 and of hexokinase II in addition to an enhanced accumulation of [18F]FDG. The accumulation of [18F]FDG had a closer correlation with hexokinase II expression than with GLUT1 expression, however [139], suggesting that hexokinase II activity was the limiting factor to tumour growth. A later study of GLUT1 expression in both primary tumors and metastatic lymph nodes of esophageal squamous cell carcinomas showed that GLUT1 expression and tumour size had a direct correlation with [18F]FDG accumulation [140]. An association has also been demonstrated between a high expression of GLUT1 on primary lesions of esophageal squamous cell carcinomas and hematogenous recurrence [141], thus confirming GLUT1 expression as an important marker of thyroid cancer.
![Figure 7 shows the [18F]FDG PET imaging of an esophageal cancer](https://openmedscience.com/wp-content/uploads/2015/02/Figure-7.-PET-Imaging-of-esophageal-cancer.png)
Figure 7. [18F]FDG PET imaging of an esophageal cancer. Full body [18F]FDG PET scan showing enhanced accumulation of [18F]FDG in a long esophageal tumour. This research was originally published in JNM. van Westreenen HL, Cobben DC, Jager PL, van Dullemen HM, Wesseling J, Elsinga PH, et al. Comparison of 18F-FLT PET and 18F-FDG PET in esophageal cancer. J Nucl Med. 2005; 46(3): 400-404 [138]. © by the Society of Nuclear Medicine and Molecular Imaging, Inc.
3.8. Other cancers
In relation to [18F]FDG PET imaging of other types of cancers, the association between [18F]FDG accumulation and expression of biological markers including GLUT1 has been investigated. Use of [18F]FDG PET for detection of gastric cancer is not straightforward since the uptake of [18F]FDG can be very variable. In a correlation study against [18F]FDG uptake, tumour size had a significant correlation and expression of HIF1α showed some correlation. The expression of GLUT1, hexokinase II and PCNA showed no correlation, however. This has lead to the suggestion that [18F]FDG uptake is a representation of tissue hypoxia rather than glucose transport in gastric cancers [142]. An overview of PET imaging in gastric cancer has been prepared by Kamimura and Masayuki [143]. Cervical cancer is the third most common cancer in women worldwide and is a significant cause of mortality in developing countries [144]. In a study to investigate the association between [18F]FDG uptake and biological marker expression in cervical cancers, [18F]FDG uptake was associated with the presence of GLUT1, nuclear hexokinase II, cytoplasmic HIF1α and VEGF and there was a significant correlation with the rate of expression of GLUT1, hexokinase II, cytoplasmic HIF1α, and carbonic anhydrase-IX (CA-IX) [145]. In thymic epithelial tumours the uptake of [18F]FDG shows a good correlation with the expression of GLUT1 and hexokinase II [146]. Consequently, [18F]FDG PET imaging is a useful tool in the diagnosis and management of thymic epithelial tumours [147]. Interim [18F]FDG PET has an essential role in the management of Hodgkin’s lymphoma during therapy and in clinical trials [148,149] and a correlation between [18F]FDG uptake and GLUT1 expression has been demonstrated [150,151]. A recent investigation of GLUT1 expression in different Hodgkin lymphoma subtypes revealed significant variability and no correlation with [18F]FDG uptake, however, suggesting that PET findings indicative of Hodgkin lymphoma relapse should always be confirmed by histological analysis [152]. [18F]FDG PET imaging also has a role in the detection and characterisation of brain tumours [153], but the brain is not usually included in routine whole body PET scans for cancers.
3.9. GLUT1 as a therapeutic target in cancer
The enhanced glycolytic activity in cancer cells required for their proliferation makes tumour glycolysis an obvious therapeutic target for the treatment and management of cancers [97,154–161]. Because GLUT1 feeds the essential nutrient glucose into glycolysis and it is essentially the first rate limiting step in glycolytic activity, the expression and/or activity of GLUT1 in tumours is therefore a therapeutic target in cancer therapy. Furthermore, the amplified expression of GLUT1 could also be used for the targeted transport of anticancer compounds into tumours [159,162–164]. Such approaches have to be specific for GLUT1 in cancer cells and not have adverse effects on glycolytic activity in normal cells.
A possible approach to cancer therapy is inhibition of GLUT1 activity by the direct binding of a small-molecule inhibitor. Recently identified inhibitors of GLUT1 include two compounds from a pairwise chemical genetic screen that inhibited glucose transport in sealed erythrocyte membranes having a non-competitive mode of inhibition with apparent Ki values of 0.8 and 1.2 μM [165], but these compounds have not been investigated thoroughly for cancer therapy. A compound call STF-31 has been identified from a high-throughput chemical synthetic lethal screen that specifically binds to and inhibits GLUT1. Treatment with STF-31 resulted in inhibition of the growth of renal cell carcinomas and no cytotoxic activity in normal tissue. This compound shows promise for clinical testing of human tumors for renal cancer therapy monitored by [18F]FDG PET [166]. A small library of novel polyphenolic ester compounds were synthesised that inhibit basal glucose transport in lung and other cancer cells and that also inhibit cell proliferation and induce apoptosis in lung and breast cancer cells by mimicking glucose deprivation [167,168]. The representative compound WZB117 [3-fluoro-1,2-phenylene bis(3-hydroxybenzoate)] (Figure 8), which inhibits glucose transport in human red blood cells, not only inhibited cell growth in cancer cell lines but also inhibited cancer growth in a mouse model. Cancer cells treated with WZB117 had decreased levels of GLUT1 expression, intracellular ATP and glycolytic enzymes resulting in a lowered rate of glycolysis and cellular growth [169]. Interestingly, the addition of exogenous ATP rescued the growth of WZB117-treated cancer cells, suggesting that the reduction of intracellular ATP plays an important role in the anticancer effect of WZB117 [159,169]. WZB117 also inhibits the self-renewal and tumor-initiating capacity of cancer stem cells in vitro and administration into an in vivo system resulted in inhibition of tumour initiation after implantation of cancer stem cells with no significant adverse effects on the host animals [170]. The naturally occurring polyphenol resveratrol (3,5,4′-trihydroxy-trans-stilbene) (Figure 8) interacts directly with GLUT1 and inhibits the transport of hexoses across the cell membrane. It is proposed that resveratrol binds at an endofacial site on GLUT1 and that the demonstrated inhibition is distinct from the effect of resveratrol on the intracellular phosphorylation/accumulation of glucose [171].
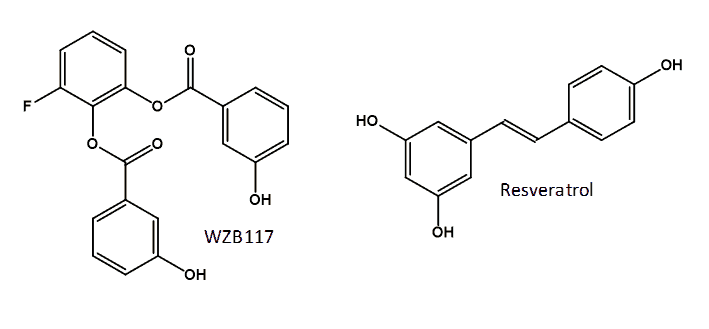
Figure 8. Structures of the GLUT1 inhibitors WZB117 and resveratrol.
Resveratrol has shown some promise for the prevention or treatment of a number of cancers, but in vivo observations are still inconsistent [172]. In a study to investigate the effect of resveratrol on cancer cell glucose metabolism and the associated role of reactive oxygen species in the response, treatment with resveratrol resulted in a significant decrease in [18F]FDG uptake. This was attributed to a reduction in glycolysis rate and GLUT1 expression [173]. Levels of intracellular reactive oxygen species and the expression of HIF-1α decreased in parallel with the [18F]FDG uptake. Because inhibitors of HIF-1α expression resulted in suppression of [18F]FDG uptake, it was proposed that resveratrol suppresses cancer cell glucose uptake by targeting reactive oxygen species-mediated HIF-1α activation [173]. A recent study in ovarian cancer cells demonstrated that selective inhibition of glucose uptake by resveratrol was due to interruption of intracellular GLUT1 trafficking to the plasma membrane associated with inhibition of Akt activity by resveratrol. Resveratrol had no affect on GLUT1 mRNA and protein expression [174]. An indirect approach to reducing GLUT1-mediated glucose uptake and resultant glycolytic activity in cancer cells is to modulate expression of GLUT1. This has been effective in altering mouse mammary tumor cell growth both in vitro and in vivo [175].
4. GLUT1 in [18F]FDG PET imaging of neurological disorders
4.1. Introduction
PET imaging of the brain enables a non-invasive in vivo examination of brain functions including cerebral blood flow, metabolism, receptor binding and their responses to neurological disorders and treatment with drugs. The wide range of neurological disorders for which PET imaging contributes to diagnosis and monitoring alongside other techniques include Alzheimer’s disease and other dementias, Parkinson’s disease and other movement disorders, epilespsy, schizophrenia, multiple sclerosis and cerebral ischemia [176–183]. Those disorders that have an altered glucose metabolism and/or blood flow can be examined by [18F]FDG PET, but a number of other radiotracers are also used for PET imaging of the brain [184].
4.2. Alzheimer’s disease
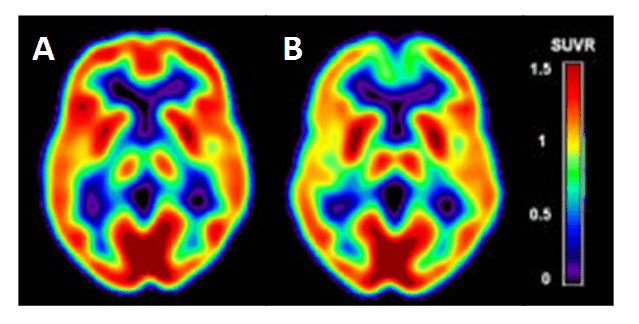
Alzheimer’s disease is the most common form of dementia, accounting for an estimated 60-80% of dementia cases [185], which starts with impairment of memory followed by multiple domains of cognitive dysfunction. [18F]FDG PET is a widely accepted clinical tool for the examination of pathophysiological changes associated with Alzheimer’s disease, especially in early stage diagnosis [186–191]. [18F]FDG PET measures the cerebral metabolic glucose utilization rate (CMRglc), which is is a standard marker of synaptic activity, neuronal function and neuronal metabolic activity [191,192]. Alzheimer’s disease is characterised in [18F]FDG PET images by a distinct pattern of hypometabolism in the regions of parietotemporal association cortices, posterior cingulate, and precuneus at early stages of the disease, which spreads to the frontal association cortices in moderate to severe stages [189]. Such regions of hypometabolism can be detected in [18F]FDG PET images in mild cognitive impairment patients not yet converted to Alzheimer’s disease and before atrophy is detected in MRI scans of the same region [186], hence the importance of [18F]FDG PET in early stage diagnosis. Cerebral [18F]FDG PET images for a cognitively normal individual with low risk for Alzheimer’s disease and an individual with high risk for Alzheimer’s disease are compared in Figure 9. Alzheimer’s disease can be distinguished in [18F]FDG PET images from other dementias, such as Lewy body dementia and frontotemporal dementia, which have different patterns of hypometabolism [193,194]. By its very nature, the regions of hypometabolism detected in [18F]FDG PET images is the result of a decrease in glucose consumption, associated with a decrease in synaptic number and with synaptic dysfunction in the neurons of affected regions prior to cell death and detectable atrophy [190,195]. As may be expected, the regions with a decrease in glucose consumption have a direct correlation with a decrease in GLUT1 expression and a downregulation of HIF-1α [196–198] and it is considered that reduction in glucose transport is a causative effect of hypometabolism in dementias
.
Figure 9. Cerebral hypometabolism in early-stage Alzheimer’s disease. Comparison of cerebral [18F]FDG PET images for a cognitively normal individual with low risk of Alzheimer’s disease (A) and an individual with high risk for Alzheimer’s disease (B). The cerebral metabolic glucose utilization rate (CMRglc) is displayed as the Standardised Uptake Value ratio (SUVR) using a colour-coded scale. This research was originally published in JAD. Mosconi L, Berti V, Glodzik L, Pupi A, De Santi S, de Leon MJ. Pre-clinical detection of Alzheimer’s disease using FDG-PET, with or without amyloid imaging. J Alzheimers Dis. 2010; 20(3): 843-854 [187]. © by IOS Press.
4.3. Parkinsons’s disease
Parkinson’s disease (PD) is the second most common age-related neurodegenerative disorder. The various parkinsonian syndromes and other movement disorders exhibit different patterns of cerebral glucose metabolism such that [18F]FDG PET is used to assist in their diagnosis and differentiation and for continuous monitoring. For example, idiopathic Parkinson’s disease (IPD), progressive supranuclear palsy (PSP) and multiple system atrophy (MSA) have some common symptoms but different pathophysiology in the cortical and subcortical structures of the brain. In addition to other differences, IPD has normal or increased glucose metabolism in the striatum but hypometabolism in temporoparietal regions, PSP has bilateral striatal and frontal hypometabolism, whilst MSA has hypometabolism in striatal, brainstem, and cerebellar regions [176,199–201]. The atypical parkinsonian syndromes of PSP and MSA have a much poorer long-term prognosis than IPD so an accurate and early differential diagnosis is important. Spatial covariance analysis has been applied to [18F]FDG PET to further characterise the cerebral metabolic pattern in PD revealing increased pallido-thalamic and pontine metabolic activity along with relative reductions in premotor cortex, supplementary motor area and in parietal association areas (Figure 10) [202]. The metabolic pattern in PSP has been further characterised by decreased accumulation in the upper brainstem and medial prefrontal cortex as well as in medial thalamus, caudate nuclei, anterior cingulated area and superior frontal cortex, whilst the MSA pattern has decreases in putamen and cerebellum [202]. Other computer-aided diagnosis methods have been used to assist in the differentiation of parkinsonian syndromes from [18F]FDG PET images [203–205]. Association between motor, cognitive and emotional dysfunction with distinct patterns of cerebral metabolic changes has also been identified in PD from [18F]FDG PET images [206]. Although GLUT1 clearly plays a role in the uptake of [18F]FDG in PET imaging of parkinsonian disorders, very little work has been performed to investigate expression and/or activity of GLUT1 in direct relation to these. One study using a mouse model of PD showed no changes in localisation or density of GLUT1 despite the impairment in glucose metabolism [207].
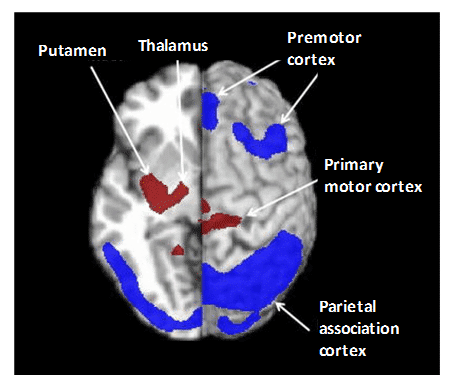
Figure 10. Pattern of cerebral glucose metabolism in Parkinson’s disease. Spatial covariance analysis of [18F]FDG PET images revealed the cerebral pattern of glucose metabolism in PD showing increased pallido-thalamic and pontine metabolic activity (red) along with relative reductions in premotor cortex, supplementary motor area and in parietal association areas (blue). This research was originally published in PET clinics. Poston KL, Eidelberg D. FDG PET in the evaluation of Parkinson’s disease. PET Clin. 2010; 5(1): 55-64 [202]. © by Elsevier Inc.
4.4. Epileptic disorders
Epileptic disorders particularly benefit from [18F]FDG PET examination when surgical treatment is a likely option since it helps to precisely identify and/or confirm the location of cerebral epileptogenic sites, which may be invisible or partially invisible to other diagnostic techniques such as electroencephalography (EEG) or MRI [208–213]. Between seizures (interictal), epileptogenic sites typically show hypometabolism and therefore a decreased accumulation of [18F]FDG [210,214,215]. During seizures (ictal), regions of hypermetabolism may also be observed so, alongside [18F]FDG PET, it is important to continuously monitor the patient with scalp EEG to confirm if there is any seizure activity during the time of [18F]FDG injection and scanning [216]. An automated computer-aided diagnostic tool for interictal [18F]FDG PET analysis of temporal lobe epilepsy has been developed. The tool operates on distributed metabolic changes across the whole brain to diagnose and lateralise epileptogenic sites and can work both independently and alongside expert analysis [217]. As already mentioned in the Introduction, defects in GLUT1 are increasingly being recognised as the cause of some genetic generalised epilepsies including early-onset absence epilepsy [58,59] and familial idiopathic generalized epilepsy [60].
4.5. Schizophrenia
In individuals with schizophrenia, cerebral glucose metabolism and pathophysiology have been investigated using [18F]FDG PET with varying results reported under both medicated and unmedicated conditions. It is considered that significant heterogeneity in the patterns of schizophrenia make investigations of its origin and mechanisms a major challenge [218]. For example, one study in unmedicated patients showed enhanced glucose metabolism in cerebral white matter, specifically in the frontal white matter, corpus callosum, superior longitudinal fasciculus and white matter core of the temporal lobe. This was accompanied by hypometabolism in grey matter, specifically in the frontal and temporal lobes, caudate nucleus, cingulate gyrus, and mediodorsal nucleus of the thalamus [219]. [18F]FDG PET has also been used to investigate the effects of antipsychotic drugs [220–223], cannabis use [224,225] and auditory verbal hallucinations [226,227] on the pattern of cerebral glucose metabolism in schizophrenia and to differentiate it from the pattern in bipolar disorder [228]. A hypothesis for pathogenesis of schizophrenia based on impaired neuronal glucose uptake by GLUT1 and GLUT3, either in expression levels or functional capacity, has been presented [229].
4.6. Multiple sclerosis
Multiple sclerosis (MS) is the most common neurological disorder diagnosed in young adults. This is an autoimmune disease characterised by loss of motor and sensory function resulting from immune-mediated inflammation, demyelination and subsequent axonal damage [230]. [18F]FDG PET analysis has revealed both widespread and regional cerebral glucose hyometabolism in MS patients [231,232] and that the global cortical cerebral metabolism decreases in correlation with disease progression [233]. Some regions of glucose hypermetabolism are also evident and thought to be compensatory effects [234,235]. Hence, [18F]FDG PET serves as a marker of disease activity in helping to understand the pathophysiological patterns in MS and their responses to therapy. [18F]FDG uptake is decreased in the thoracic and lumbar spinal cord regions of MS patients, which could be associated with autonomic nervous system and motor dysfunctions [236]. Also, MS patients sometimes have asymmetries in comparative strengths of leg muscles accompanied by walking difficulties and this is in correlation with glucose uptake according to [18F]FDG PET [237]. The exact origins and mechanisms of MS pathogenesis are yet to be unravelled, but the perturbed glucose metabolism has been considered as a cause as well as a consequence in MS [238]. An absence of the β2-adrenergic receptor (β2AR) in astrocytes occurs in MS patients, and since β2AR promotes glucose uptake through GLUT1 and accelerates glucose metabolism, a downregulation of β2AR activity may accelerate the development of MS [239]. β2AR and/or GLUT1 are therefore potential therapeutic targets for upregulation in the prevention or treatment of MS.
4.7. Cerebral ischemia
Cerebral ischemia and its response to potential therapies has been investigated using [18F]FDG PET with the large majority of studies performed in animal or in vitro models due the nature of strokes. Under conditions of oxygen deprivation in living brain slices, which is consistent with acute cerebral ischemia, a hyperaccumulation of [18F]FDG was demonstrated especially in the hippocampus and thalamus. The enhanced glucose metabolism was associated with an increased glutamate efflux after hypoxia and anoxia and glucose metabolism was also increased by the addition of glutamate and attenuated by an N-methyl-D-aspartate (NMDA) receptor antagonist. It was therefore considered that activation of NMDA receptors by glutamate during acute cerebral ischemia might be responsible for the hyperutilization of glucose in the hippocampus and thalamus [240]. Tissue regions of interest in cerebral ischemia include the ischemic core, the border that progresses to infarction (recruited tissue) and the border that recovers with early reperfusion (recoverable tissue). [18F]FDG PET studies in rat models have shown that in the ischemic core glucose consumption is severely depressed due to irreversible cellular injury, whilst it is maintained or increased in the penumbral regions during ischemia. Early after reperfusion, glucose consumption is severely reduced even though glucose and oxygen are available, but this glycolytic depression is not always related to subsequent development of brain infarction [241–243].
Consequently, [18F]FDG PET is considered as a potential tool for the management of acute stroke patients along with other techniques such as MRI and CT [244]. In a rat model of permanent cerebral ischemia with or without post-stroke exercise, a [18F]FDG PET study of metabolism in both the damaged and undamaged cortical hemispheres has demonstrated that exercise can accelerate a reverse in the hypometabolism caused by ischemia [245]. [18F]FDG PET studies have also been used to demonstrate functional recoveries following cerebral ischemia by treatments with the natural product scutellarin [246], the herbal medicine Danhong [247] and after transplantation of induced pluripotent stem cells [248]. In rat brain, GLUT1 overexpression occurs rapidly and widely in microvessels and parenchyma following global cerebral ischemia, which may be associated with an immediate early-gene form of response to cellular stress [249], and cerebral hypoxia-ischemia leads to overexpression of GLUT1 in both damaged and undamaged hemispheres during both early and late stages in the recovery period [250,251]. Diabetic conditions combined with cerebral ischemia produced an even higher overexpression of GLUT1, although expression tended to decrease with increased blood glucose levels. It was therefore considered that in the treatment of diabetic patients with cerebral ischemia, blood glucose control should not be too strict, otherwise the up-regulation of GLUT1 induced by ischemia may not meet the requirements of energy metabolism the in cells [252]. The upregulation of cerebral GLUT1 (and GLUT3) is considered as a potential preventative neuroprotive therapy for ischemia [253]. Because hyperglycemia is an indicator of severe stroke and this promotes further ischemia in the brain, cerebral GLUTs are also considered as a therapeutic target for post ischemic stroke treatments [254].
5. GLUT1 in [18F]FDG PET imaging of cardiovascular diseases
5.1. Introduction
Cardiovascular diseases include all those of the heart and blood vessels such as coronary heart disease, congenital heart disease, peripheral arterial disease and stroke. These can be linked to each other and to underlying conditions such as atherosclerosis, cardiac sarcoidosis, inflammation and infection. [18F]FDG PET imaging can be used to monitor blood flow to the heart muscle, identify the effects of a heart attack on areas of the heart, distinguish viable tissue from scar tissue, locate regions that may benefit from surgical procedures and examine changes in blood flow and/or glucose metabolism that occur in a range of cardiovascular diseases and underlying conditions. [18F]FDG PET can also be used to assess function and identify and monitor sites of infection in implantable cardiac devices and in prosthetic valves. Because myocardial glucose consumption can have wide variation under different normal metabolic and physiological states, which can overlap with changes in glucose metabolism under pathologic conditions, a careful regulation of the metabolic environment is required for performing cardiovascular [18F]FDG PET imaging [255]. It is beyond the scope of this review to include all published results for the PET imaging of cardiovascular diseases using [18F]FDG, so the remainder of this section will consider the roles of GLUT1 in [18F]FDG PET imaging of some common and pertinent cardiovascular diseases and underlying conditions and of infections in implantable devices and prosthetics.
5.2. Heart failure and myocardial ischemia
Left ventricular dysfunction with subsequent heart failure constitutes the final common pathway for a number of cardiac disorders. In patients with left ventricular dysfunction and an adequate amount of hibernating myocardium, coronary revascularisation may provide a significant improvement in left ventricular contractility along with a better long-term prognosis. Alongside other imaging techniques, [18F]FDG PET can be used to examine the left ventricular myocardium for residual glucose metabolism and reversible loss of systolic function. This assessment of myocardial viability is essential for determining the route of action and likelihood of survival in patients with heart failure [256–261]. Right ventricle dysfunction in heart failure is also associated with metabolic changes including an increase in right ventricle [18F]FDG accumulation, the magnitude of which is correlated with severity [262]. One of the characteristics of pulmonary arterial hypertension is metabolic remodelling of the right ventricle, which can lead to right ventricle failure. Because this includes an increase in glycolysis, [18F]FDG PET is used for identifying pulmonary hypertension and right heart failure [263–265]. [18F]FDG PET is also used for assessing blood flow and metabolism in general myocardial ischemia and heart failure [256,266–268]. In line with the increased glucose metabolism, histochemical studies have shown that persistent myocardial ischemia increases GLUT1 expression in both ischemic and non-ischemic regions of the heart [269].
5.3. Inflammation
Inflammation of cardiovascular tissues including inner surfaces of the heart such as valves (infective endocarditis), heart muscle (myocarditis), pericardium that surrounds the heart (pericarditis) or of blood vessels (vasculitis) may be a cause or symptom of other cardiovascular disorders. Some of these inflammations are caused by bacterial or viral infections, autoimmune diseases, environmental toxins or adverse reactions to drugs. Because the regions of inflammation have increased blood supply and rates of glycolysis, [18F]FDG PET has emerged as an important tool in the diagnosis and monitoring of these cardiovascular inflammations [270]. Infective endocarditis (IE) is usually caused by bacterial infection of the heart valves or lining of the endocardium. A high rate of mortality means that rapid diagnosis of IE is essential followed by aggressive antibiotic and or/surgical treatment. Alongside other techniques such as CT, echocardiography and MRI, [18F]FDG PET is important in the early diagnosis of IE [271–275]. Related to IE, the bacterial or fungal infection of implantable cardiac devices and prosthetic valves has potential fatal consequences unless diagnosed at an early stage followed by urgent antibiotic therapy, device extraction or surgical intervention. Diagnosis and identification of the infection site is challenging, but [18F]FDG PET is useful for detecting inflammatory cells early in the infection process before more serious morphologic damages occur [276–282]. An [18F]FDG PET-CT image from a patient with a cardiac device infection is shown in Figure 11, which reveals enhanced [18F]FDG uptake on both the generator and pacemaker lead [274].
![Figure 11 shows the [18F]FDG PET-CT image of cardiac device infection.](https://openmedscience.com/wp-content/uploads/2015/02/Figure-11.-PET-CT-Scan.png)
Figure 11. [18F]FDG PET-CT image of cardiac device infection. An [18F]FDG PET-CT image from a patient with a cardiac device infection is showing an enhanced [18F]FDG uptake on both the generator and the pacemaker lead (arrows). This research was originally published in European Heart Journal. Bruun NE, Habib G, Thuny F, Sogaard P. Cardiac imaging in infectious endocarditis. Eur Heart J. 2014; 35(10): 624-632 [274]. © by European Society of Cardiology.
Myocarditis is most often due to infection by common viruses or a hypersensitivity response to medications [283]. [18F]FDG PET has been used in the detection of myocarditis, for example due to infection by Epstein Barr virus [284,285]. Pericarditis may be caused by bacterial, viral or fungal infection or can present post-infarction (within 24 hours of a heart attack), or weeks to months after a heart attack (Dressler’s syndrome). [18F]FDG PET has been used for the visualisation of pericarditis [286,287], which includes applications in the diagnosis of postmeningococcal pericarditis [288], chemotherapy-induced pericarditis [289] and focal pericarditis in a huge heart [290]. [18F]FDG PET has also been used to identify tuberculosis pericarditis, a rare extra-pulmonary manifestation of tuberculosis, monitor its response to antituberculosis therapy and to differentiate acute tuberculous from idiopathic pericarditis [291–295]. One case of suspected pericarditis investigated by [18F]FDG PET actually turned out to be large vessel vasculitis [296]. The non-specific nature of [18F]FDG PET makes whole body scans especially suited to the diagnosis and monitoring of large vessel vasculitis, which can present with non-specific signs and symptoms [297–300]. A common form of vasculitis is giant cell arteritis, which shows a close clinical association with the musculoskeletal inflammatory disorder polymyalgia rheumatica [301,302]. High [18F]FDG uptake is seen in the large vessels including aorta, subclavian, carotid, iliac and femoral arteries. Takayasu arteritis, a chronic nonspecific granulomatous vasculitis affecting aorta and its main branches, coronary and pulmonary arteries, is also diagnosed and monitored using [18F]FDG PET alongside other imaging techniques [303–306]. Although GLUT1 clearly has an important role in the uptake of [18F]FDG in these PET studies of inflammatory cardiovascular conditions, no investigations of a correlation with patterns of GLUT1 expression or activity have been reported.
5.4. Cardiac sarcoidosis
Sarcoidosis is a condition involving abnormal collections of inflammatory cells or granulomas that can form nodules in multiple organs. The cause of sarcoidosis is still not fully understood, but it appears to be triggered by infectious or environmental agents that act as antigens. These antigens are thought to trigger helper inducer T cells into forming the granulomas. At the early inflammation stage, the granuloma lesions contain mononuclear phagocytes and CD4 positive T cells with a T helper Type 1 response, secreting interleukin-2 and interferon-g. At the later fibroblastic stage, there is a shift to a T helper type 2 response which produces anti-inflammatory effects and results in tissue scarring [307,308]. Sarcoidosis can affect any region of the heart, but most often the myocardium, and lead to other cardiac disorders such as heart block, ventricular arrhythmias, congestive heart failure, pulmonary hypertension and ventricular aneurysms. Hence, cardiac sarcoidosis has a poor prognosis so an early and accurate diagnosis is important for achieving any successful outcome. Due to the non-specific clinical symptoms of the disease, erratic myocardial involvement and uncertainty of diagnostic tests the detection and management of cardiac sarcoidosis is challenging [309,310]. [18F]FDG PET is emerging as a useful tool alongside other imaging techniques for the examination of cardiac sarcoidosis [311–316], an example is shown in Figure 12. The variable physiological uptake of [18F]FDG into the myocardium complicates the detection of enhanced [18F]FDG uptake into sarcoidosis lesions so a long fasting state and other strict preparations are necessary for the most sensitive and accurate assessment [311,317–319]. Under fasting conditions normal myocardial cells use free fatty acids for up to 90% of their oxygen consumption [320], which therefore suppresses glycolytic acitivity and the uptake of [18F]FDG. In recent years [18F]FDG PET has improved the detection and monitoring of cardiac sarcoidois, but it is suggested that more developments are required in distinguishing physiological uptake from disease regions and coordinating the effects of treatments with assessment of disease state [317].
.
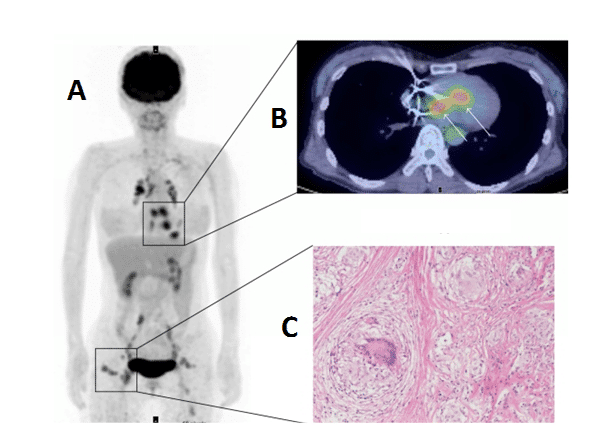
Figure 12. [18F]FDG PET imaging of cardiac sarcoidosis. Whole body (A) and transverse (B) [18F]FDG PET images revealing enhanced [18F]FDG uptake into cardiac sarcoidosis granuloma lesions in the heart. The whole body image also reveals other sarcoidosis lesions with enhanced [18F]FDG uptake in chest, lymph nodes and subcutaneous tissue. An image of a non-caseating sarcoidosis granuloma is also shown (C). This research was originally published in BioMed Research International. Orii M, Imanishi T, Akasaka T. Assessment of cardiac sarcoidosis with advanced imaging modalities. Biomed Res Int. 2014; 2014: 897956 [317]. © 2014 Makoto Orii et al.
5.5. Atherosclerosis
Atherosclerotic cardiovascular diseases, including coronary heart disease, myocardial infarction and stroke, are the most common cause of death and disability in the developed world. The progressive inflammation and potential rupture of atherosclerotic plaques in arterial walls is due to infiltration by macrophages. Rupture can lead to the formation of a blood clot, which may block the artery resulting in a heart attack or it can be carried downstream causing a stroke. Because glucose uptake and metabolism by macrophages is significantly higher than in other plaque cells, [18F]FDG PET is an important tool for identifying vulnerable atherosclerotic plaques, assessing risk factors to future cardiovascular events and monitoring the effects of anti-atherosclerotic treatments such as anti-inflammatory drugs and statins, lifestyle changes or surgery [321–325]. Indeed, [18F]FDG PET has already been used in clinical drug trials for treatments of atherosclerosis [326,327]. The inflammation in atherosclerotic plaques detected by [18F]FDG PET also has a direct positive correlation with neovascularisation detected by dynamic contrast-enhanced-MRI [328]. The determinants of [18F]FDG uptake in atherosclerotic plaques have been the subject of a number of studies and commentaries, including extra considerations for individuals with type 2 diabetes [329,330]. One study suggests that [18F]FDG PET detects the early stage of foam cell formation in atherosclerosis [331] and another suggests that [18F]FDG uptake reflects hypoxia-stimulated macrophages rather than just an inflammatory effect and that cytokine-activated smooth muscle cells may also contribute to the [18F]FDG uptake [332]. In relation to atherosclerotic inflammation, it has been shown that oxidized low-density lipoprotein is a strong stimulator of macrophage [18F]FDG uptake and glycolysis through upregulation of GLUT1 and hexokinase expression. This metabolic response is mediated by Nox2-dependent reactive oxygen species generation that promotes HIF-1α activation [333]. Some novel variations and alternatives to [18F]FDG PET have been developed for assessing atherosclerotic plaques. [18F]Sodium fluoride has been used as an alternative PET tracer and novel marker of plaque biology in terms of calcification. The [18F]sodium fluoride tracer is not hampered by physiological myocardial activity in the same way as [18F]FDG analysis of inflammation and it shows potential for the assessment of plaque vulnerability and future cardiovascular risk [334]. An example of a combined [18F]FDG and [18F]sodium fluoride PET study of atherosclerosis is shown in Figure 13.
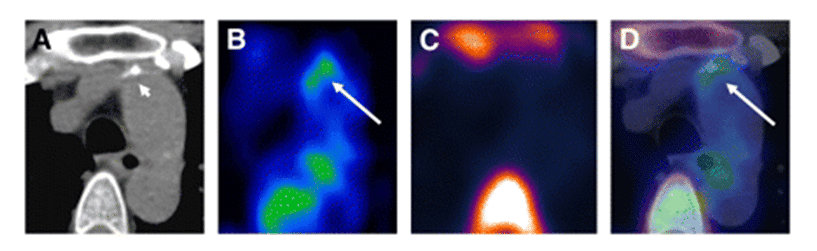
Figure 13. PET-CT analysis of an atherosclerotic plaque in the ascending aorta. Transaxial CT (A), [18F]FDG PET (B), [18F]sodium fluoride PET (C) and fused [18F]FDG/[18F]sodium fluoride PET-CT images (D) of an atherosclerotic plaque in the ascending aorta are shown. The enhanced uptake of [18F]FDG coincides with calcification but not with [18F]sodium fluoride accumulation. [18F]FDG uptake adjacent to the esophagus represents activity spilled over from the esophageal wall. Short arrow = calcification; long arrow = tracer uptake. This research was originally published in JNM. Derlin T, Tóth Z, Papp L, Wisotzki C, Apostolova I, Habermann CR, et al. Correlation of inflammation assessed by 18F-FDG PET, active mineral deposition assessed by 18F-fluoride PET, and vascular calcification in atherosclerotic plaque: a dual-tracer PET/CT study. J Nucl Med. 2011; 52(7): 1020-1027 [335]. © by the Society of Nuclear Medicine and Molecular Imaging, Inc.
A non-radioactive assay of atherosclerotic plaque inflammation in a mouse model has been developed based on mass spectrometry detection of trapped FDG-6-phosphate and of cholesterol. FDG-6-phosphate was accumulated in atherosclerotic lesions from arteries and anti-atherosclerotic effects were seen following treatment with the liver X receptor agonist T0901317 [336]. 2-Deoxy-2-[18F]fluoro-D-mannose or [18F]FDM has been used as an alternative to [18F]FDG for PET imaging of atherosclerosis [337]. [18F]FDM is suitable for this purpose because mannose is transported by GLUT1 and mannose receptors are expressed on a subset of the macrophage population in high-risk atherosclerotic plaques. In a rabbit model, there was comparable uptake of [18F]FDM and [18F]FDG in atherosclerotic lesions and uptake of [18F]FDM was proportional to the plaque macrophage population. FDM also restricted binding of anti-mannose receptor antibody to macrophages by approximately 35%, so mannose receptors may be an additional target for imaging of plaque inflammation [337]. A novel system for dual-modality imaging of atherosclerotic plaques using the glucose probes [18F]FDG and fluorescent 6-(N-(7-nitrobenz-2-oxa-1,3-diazol-4-yl)amino)-6-deoxyglucose (6-NBDG) has been developed. The system allowed detection of both [18F]FDG and 6-NBDG taken up by mouse atherosclerotic plaques and demonstrates 6-NBDG as a promising fluorescent probe for detection of macrophage-rich atherosclerotic plaques [338].
6. Diabetic effects on PET imaging using [18F]FDG and roles of GLUT1
6.1. Introduction
Patients with unmanaged diabetes mellitus are likely to present with hyperglycemia along with an altered metabolism and distribution of [18F]FDG. Hence, an underlying diabetic condition could hinder the detection and monitoring of other diseases using [18F]FDG PET. Diabetes also has a direct association with other diseases, for example in accelerating atherosclerosis and dramatically increasing the risk of cardiovascular diseases. [18F]FDG PET can be used to follow the altered metabolism and distribution of [18F]FDG caused by diabetes and monitor the effects of anti-diabetic drugs and new potential therapies such as activation of brown adipose tissue. Although GLUT4 is the insulin-regulated glucose transporter found primarily in adipose tissues and striated muscle, GLUT1 polymorphisms are implicated as a cause in diabetic nephropathy and GLUT1 expression levels are altered in various tissues under diabetic conditions. GLUT1 is also a therapeutic target for the suppression of some diabetic complications.
6.2. Altered distribution of [18F]FDG in patients with diabetes
The elevated glucose levels in patients with diabetes may cause an altered metabolism and distribution of [18F]FDG including competitive inhibition of [18F]FDG uptake in different tissues. The altered distribution of [18F]FDG in type 2 diabetes under control of insulin or oral anti-diabetics include an increase in diffuse uptake along with a decrease in segmental uptake in colon, a significant increase in uptake in bowel and a significant decrease in cardiac uptake [339]. Type 2 diabetes is significantly associated with increased carotid wall [18F]FDG uptake in patients with known or suspected cardiovascular disease. Obesity and smoking also have a significant association with increased [18F]FDG uptake in patients with diabetes [340]. [18F]FDG-PET also shows a significant association between impaired glucose tolerance and type 2 diabetes with vascular inflammation in carotid atherosclerosis [341]. Dynamic triple-tracer PET studies using [15O]H2O, [11C]3-O-methyl-D-glucose and [18F]FDG have shown that the skeletal muscle insulin resistance associated with obesity and type 2 diabetes involves a severe impairment of glucose transport and an impairment in the efficiency of glucose phosphorylation [342]. [18F]FDG-PET has been used to show how bariatric surgery modifies the metabolic pattern of the whole body and different tissues in slightly obese patients with type 2 diabetes. The effects of the surgery included a significant and stable increase in glucose uptake into skeletal and cardiac muscle along with lowered blood levels of both insulin and glucose, consistent with an improvement in glucose tolerance [343]. The insulin resistance that is a causal factor in pre-diabetes and type 2 diabetes also increases the risk of developing Alzheimer’s disease. Under conditions of hyperglycemia, which may be present in individuals with diabetes, the cerebral distribution of [18F]FDG is altered with some regions of decreased uptake resembling those of Alzheimer’s disease [344]. Furthermore, cerebral [18F]FDG-PET analysis of cognitively normal adults with pre-diabetes or early type 2 diabetes has shown an Alzheimer’s-like pattern of reduced glucose metabolism in frontal, parietotemporal and cingulate regions. These metabolic alterations were associated with subtle cognitive impairments at the earliest stage of Alzheimer’s disease, even before the onset of mild cognitive impairment [345]. [18F]FDG PET can also be used for the diagnosis of diabetes-related infections, for example in the diabetic foot (Figure 14). The precise localisation of increased [18F]FDG uptake allows accurate differentiation between osteomyelitis and soft-tissue infection [346].
![Figure 14 shows the [18F]FDG PET-CT diagnosis of diabetes-related osteomyelitis in the foot.](https://openmedscience.com/wp-content/uploads/2015/02/Figure-14.-PET-CT-of-diabetes.png)
Figure 14. [18F]FDG PET-CT diagnosis of diabetes-related osteomyelitis in the foot. Coronal (A) and transaxial (B) [18F]FDG PET images showing enhanced [18F]FDG uptake in the lateral region of the forefoot. A [18F]FDG PET-CT image (C) localises the enhanced [18F]FDG uptake to the head of the fourth metatarsal. A CT scan shows normal bone structure in the corresponding area (D). Subsequent histopathic examination confirmed osteomyelitis in the soft tissues. This research was originally published in JNM. Keidar Z, Militianu D, Melamed E, Bar-Shalom R, Israel O. The diabetic foot: initial experience with 18F-FDG PET/CT. J Nucl Med. 2005; 46(3): 444-449 [346]. © by the Society of Nuclear Medicine and Molecular Imaging, Inc.
6.3. Effects of diabetes on measuring [18F]FDG uptake in the diagnosis of other diseases
A concern for performing [18F]FDG PET analyses under diabetic conditions is that elevated glucose levels or altered metabolism might hinder the detection and monitoring of other diseases, especially in oncologic imaging. Along with changes in blood glucose levels, insulin and obesity, diabetes affects the distribution of [18F]FDG in muscle tissue and the brain. Whilst tumoral uptake of [18F]FDG is not significantly affected, these other changes may influence the tumoral detection rate [347]. Interestingly, it has been shown that high glucose levels at the time of the study but not diabetes may reduce the sensitivity of [18F]FDG-CT in the assessment of cancers and no significant impact on the false-negative rate was found in patients with infection and inflammatory processes with either diabetes or hyperglycemia [348]. In an [18F]FDG PET study of patients with localised esophageal cancer, glucose levels and diabetes had no influence on pretreatment detection, but diabetes did complicate interpretation of the response to treatment [349]. In another study, chronic hyperglycemia due to diabetes had no adverse affect on the [18F]FDG PET detection rate of various cancers. [18F]FDG uptake by the majority of tumours was maintained at a sufficiently high level for clinical diagnosis, except in the few cases of low [18F]FDG-avid tumours or small lesions of 15 mm or less in size [350]. In comparison with normal patients, the accuracy of [18F]FDG PET detection of cervical cancer was not significantly reduced in patients with mild to moderate diabetes [351]. Although not always essential, different preparation procedures may be required for [18F]FDG PET imaging of patients with diabetes at the time of [18F]FDG injection in order to improve diagnostic scheduling and provide the most sensitive and accurate assessment [352,353]. For example, the poor image quality of [18F]FDG PET scans associated with patients that have uncontrolled diabetes can be improved by injecting ultrashort-acting insulin 60 minutes prior to the injection of [18F]FDG [354].
6.4. Effects of anti-diabetic drugs
The effects of anti-diabetic drugs on glucose metabolism have been assessed using [18F]FDG PET imaging. The biguanide metformin is the first-line drug for prevention and treatment of type 2 diabetes, especially in overweight and obese patients. Metformin works by helping to restore the body’s proper response to insulin, suppressing glucose production by the liver and its absorption by the stomach/intestines. This is usually used alongside diet and exercise lifestyle changes. In type 2 diabetic patients, metformin treatment significantly increases [18F]FDG uptake in the walls and lumen of the large intestine and, to a lesser extent, in the small intestine [355,356]. It may therefore be useful to cease metformin treatment before performing any oncologic [18F]FDG PET assessment of the intra-abdominal region [355]. Indeed, the discontinuation of metformin treatment for two or three days is sufficient for reducing the high intestinal [18F]FDG uptake induced by metformin [357,358]. In a model of diet-induced hyperinsulinemia associated with increased insulin receptor activation in tumours and with increased tumor [18F]FDG uptake, metformin abolished the diet-induced increases in serum insulin, tumor insulin receptor activation and tumour [18F]FDG uptake associated with the high energy diet. These observations led to the suggestion that metformin could be considered in clinical trials as a treatment for cancers [359]. A later study showed that metformin produces a dose-dependent increase in tumor [18F]FDG uptake while decreasing cell proliferation in colon cancer cells, suggesting that changes in [18F]FDG uptake following metformin treatment may be misleading. PET imaging using 3′-deoxy-3′-[18F]-fluorothymidine was advocated as a promising alternative for correlating metformin treatment with tumour response [360]. A recent [18F]FDG PET study of the effects of metformin on cerebral metabolic changes in type 2 diabetes revealed significant increases in glucose metabolism in right temporal and frontal and left occipital lobe white matter and decreases in left parahippocampal gyrus, left fusiform gyrus and ventromedial prefrontal cortex [361].
6.5. Brown adipose tissue
Brown adipose tissue (BAT) has recently emerged as a potential target in the treatment of obesity and type 2 diabetes. The main function of BAT is to burn energy and glucose to generate body heat [362,363], this is in contrast to white adipose tissue which has a main function of energy storage. BAT is especially abundant in newborns and in hibernating mammals where it is important for preventing hypothermia. In adult humans, [18F]FDG PET imaging has shown that BAT is still present in the upper chest and neck and this becomes more metabolically active with exposure to cold and less active if an adrenergic beta blocker is administered before the scan. [18F]FDG PET-CT is currently the most useful tool for the molecular imaging of BAT metabolic activity and its roles in human health and disease [364]. In performing [18F]FDG PET imaging of BAT in humans, factors such as outdoor temperature, age, sex, body mass index and diabetic status determine its abundance and [18F]FDG-uptake activity [365]. Lower outdoor temperatures increase the abundance and metabolic activity of BAT whilst increasing age, obesity and diabetes have the opposite effect. These variables are of course interlinked and so the decrease in BAT with increasing age may be a causative factor of middle-age obesity. Hence, maintaining or increasing the level of BAT may be a preventative measure or treatment for obesity and diabetes [365–367]. Prolonged fasting induces insulin resistance in peripheral tissues in order to prioritise glucose supply for the brain. [18F]FDG PET measurements under fasting-induced insulin resistance conditions revealed a significant decrease in cold-induced BAT glucose uptake along with a decrease in non-shivering thermogenesis during cold stimulation.
Reduction of glucose uptake in BAT was due to impaired cellular glucose uptake and not due to decreased supply [368]. This study concluded that cold-induced activation of BAT may not be feasible for achieving glucose clearance by BAT under diabetic conditions. [18F]FDG PET measurements of BAT glucose metabolism in mouse models showed a significant decrease in [18F]FDG uptake into BAT under conditions of both obesity and diabetes (Figure 15). Treatment with a β3-adrenergic receptor (β3-AR) agonist reversed this trend to produce a significant increase in BAT [18F]FDG uptake in both obese and diabetic conditions, which was accompanied by significantly decreased blood glucose levels. Treatment with the thyroid hormone levothyroxine also increased BAT [18F]FDG uptake under obese conditions but not under diabetic conditions. Activation of BAT may therefore be a useful strategy in the treatment of obesity and diabetes [369]. This possibility has been confirmed by a recent [18F]FDG PET-CT study demonstrating activation of human BAT by the β3-AR agonist mirabegron (Figure 15) [370]. A new signalling pathway has also recently been revealed for β3-AR stimulation of GLUT1-mediated glucose uptake in BAT cells [371]. In addition to β3-AR stimulation of cAMP-mediated increases in GLUT1 transcription and de novo synthesis of GLUT1, there is also β3-AR stimulation of mTOR complex 2, which itself stimulates translocation of newly synthesized GLUT1 to the plasma membrane. Both parts are essential for β3-AR-stimulated glucose uptake and this is independent of the classical PI3K/Akt pathway [371].
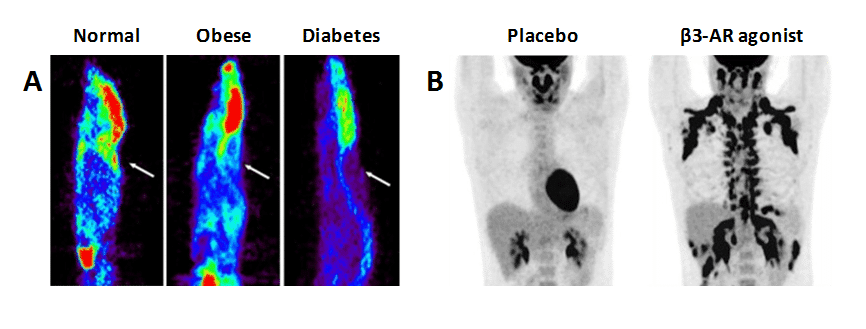
Figure 15. Effects of obesity and diabetes on brown adipose tissue and its activation by β3-adrenergic receptor agonists. A. [18F]FDG microPET images of normal, obese and diabetic mice after cold stimulation on ice for 1 hour. The arrows show the position of interscapular BAT uptake of [18F]FDG, which is decreased in the obese and diabetic mice. Treatment with the β3-adrenergic receptor agonist BRL37344 significantly increased the BAT-to-liver ratio of [18F]FDG uptake in the obese and diabetic mice compared to controls (not shown). This research was originally published in PLos One. © 2014 Wu et al [369]. B. [18F]FDG PET images of a 21 year old man treated with a placebo or with the β3-adrenergic receptor agonist mirabegron. Mirabegron acutely stimulates [18F]FDG uptake and BAT activity in multiple depots and is therefore a predictor of whole-body thermogenesis. This research was originally published in Cell Metabolism. Cypess AM, Weiner LS, Roberts-Toler C, Elía EF, Kessler SH, Kahn PA, et al. Activation of human brown adipose tissue by a β3-adrenergic receptor agonist. Cell Metab. 2015; 21(1): 33-38 [370]. © by Elsevier Inc.
6.6. Further roles of GLUT1 in diabetes and therapy
Renal tubular glucose reabsorption is mediated by sugar transporters including GLUT1. Glucose transport in the diabetic kidney is upregulated and has been implicated in the pathogenesis of progressive diabetic nephropathy [372]. Hyperglycemia, hypertension and activation of the renin-angiotensin system are thought to be important in the development of the disease and expression levels of GLUT1 are elevated under conditions of hypertension and diabetic nephropathy [373,374]. Polymorphisms of the GLUT1 gene are associated with susceptibility to diabetic nephropathy in both type 1 and type 2 diabetes [372,375–377]. Skeletal muscle GLUT1 expression and basal leg glucose uptake are reduced in type 2 diabetes [378]. The anti-ischemic drug mildronate, which suppresses fatty acid metabolism and increases glucose utilisation in myocardium, has also been shown to normalise the diabetes-induced upregulated expression levels of GLUT1 in kidneys, heart, muscle and liver [379]. Red blood cell glucose transport in patients with type 2 diabetes is decreased whilst the abundance of GLUT1 is apparently unchanged and its affinity for binding cytochalasin B is increased [380]. In contrast, adolescents with type 1 diabetes display reduced levels of GLUT1 in red blood cells and this has been considered as a contributing factor to the perturbed cognition in adolescents with type 1 diabetes [381]. The suppression of GLUT1 has been considered as a strategy for preventing diabetic complications, especially of diabetic retinopathy. GLUT1 is the sole glucose transporter between blood and retina so it is an obvious target for reducing the high glucose levels in retina under conditions of diabetic retinopathy. In an animal model of diabetes, treatment with the GLUT1 inhibitors forskolin or genistein significantly reduced retinal glucose to the same levels as in non-diabetics. Forskolin prevented early biomarkers of diabetic retinopathy, including elevation of superoxide radicals, increased expression of the chaperone β2 crystallin and increased expression of vascular endothelial growth factor [382]. GLUT1 is therefore a potential therapeutic target for the prevention of diabetic retinopathy.
7. Conclusions
This review has highlighted the important roles that facilitative transport protein GLUT1 plays in positron emission tomography (PET) imaging of human diseases using 2-deoxy-2-[18F]fluoro-D-glucose ([18F]FDG) as the radiotracer. [18F]FDG uptake is a marker of glucose transport and glycolytic activity and altered patterns in localised regions of tissues and organs are associated with certain diseases. [18F]FDG PET imaging is now a routine clinical tool used in the diagnosis, monitoring and analysis of response to treatments for cancers, neurological disorders, cardiovascular diseases and underlying conditions such as atherosclerosis. All of these can be affected by diabetes, which alters the metabolism and distribution of [18F]FDG. The effects of anti-diabetic drugs on glucose metabolism and activation of brown adipose tissue as a preventative measure or treatment for obesity and diabetes have been investigated using [18F]FDG PET. Expression and/or activity levels of GLUT1 have direct affects on [18F]FDG uptake, which are controlled by the PI3K/AKT/mTOR signaling pathway, and can be increased or decreased under disease conditions. Mutations in GLUT1 are associated with GLUT1 deficiency syndrome and some epileptic disorders and single nucleotide polymorphisms in the GLUT1 gene are associated with a genetic susceptibility to some cancers and to diabetic nephropathy. GLUT1 itself is a potential therapeutic target for the treatment of some human diseases. Inhibition of GLUT1 expression and/or activity is a potential strategy for cancer therapy or GLUT1 could be used for the targeted transport of anticancer compounds into tumours. Upregulation of GLUT1 expression is a potential approach for the prevention or treatment of some neurological disorders including multiple sclerosis and cerebral ischemia. GLUT1 is also a potential therapeutic target for the suppression of some diabetic complications and obesity. Development of such therapies targeting GLUT1 will benefit from analysis by [18F]FDG PET imaging.
Conflict of interest
The author confirms that this article content has no conflict of interest.
Funding
This work was supported by the EU EDICT consortium (contract 201924).
References
Key References: 13, 36, 63, 84, 92, 169, 177, 326, 339, 369
- Pao SS, Paulsen IT, Saier MH Jr. Major facilitator superfamily. Microbiol Mol Biol Rev. 1998; 62(1): 1-34. [PubMed Abstract]
- Saier MH Jr, Beatty JT, Goffeau A, Harley KT, Heijne WH, Huang SC, et al. The major facilitator superfamily. J Mol Microbiol Biotechnol. 1999; 1(2): 257-279. [PubMed Abstract]
- Reddy VS, Shlykov MA, Castillo R, Sun EI, Saier MH Jr. The major facilitator superfamily (MFS) revisited. FEBS J. 2012; 279(11): 2022-2035. [CrossRef] [PubMed Abstract]
- Iancu CV, Zamoon J, Woo SB, Aleshin A, Choe JY. Crystal structure of a glucose/H+ symporter and its mechanism of action. Proc Natl Acad Sci U S A. 2013; 110(44): 17862-17867. [CrossRef] [PubMed Abstract]
- Joost HG, Thorens B. The extended GLUT-family of sugar/polyol transport facilitators: nomenclature, sequence characteristics, and potential function of its novel members (review). Mol Membr Biol. 2001; 18(4): 247-256.[PubMed Abstract]
- Uldry M, Thorens. The SLC2 family of facilitated hexose and polyol transporters. Pflugers Arch. 2004; 447(5): 480-489. [CrossRef] [PubMed Abstract]
- Zhao FQ, Keating AF. Functional properties and genomics of glucose transporters. Curr Genomics. 2007; 8(2): 113-128. [PubMed Abstract]
- Manolescu AR, Witkowska K, Kinnaird A, Cessford T, Cheeseman C. Facilitated hexose transporters: new perspectives on form and function. Physiology (Bethesda). 2007; 22: 234-240. [CrossRef] [PubMed Abstract]
- Carruthers A, DeZutter J, Ganguly A, Devaskar SU. Will the original glucose transporter isoform please stand up! Am J Physiol Endocrinol Metab. 2009; 297(4): E836-E848. [CrossRef] [PubMed Abstract]
- Augustin R. The protein family of glucose transport facilitators: It’s not only about glucose after all. IUBMB Life. 2010; 62(5): 315-333. [CrossRef] [PubMed Abstract]
- Thorens B, Mueckler M. Glucose transporters in the 21st century. Am J Physiol Endocrinol Metab. 2010; 298(2): E141-E145. [CrossRef] [PubMed Abstract]
- Cura AJ, Carruthers A. Role of monosaccharide transport proteins in carbohydrate assimilation, distribution, metabolism, and homeostasis. Compr Physiol. 2012; 2(2): 863-914. [CrossRef] [PubMed Abstract]
- Mueckler M, Thorens B. The SLC2 (GLUT) family of membrane transporters. Mol Aspects Med. 2013; 34(2-3): 121-138. [CrossRef] [PubMed Abstract]
- Kasahara M, Hinkle PC. Reconstitution and purification of the D-glucose transporter from human erythrocytes. J Biol Chem. 1977; 252(20): 7384-7390. [CrossRef] [PubMed Abstract]
- Zoccoli MA, Baldwin SA, Lienhard GE. The monosaccharide transport system of the human erythrocyte. Solubilization and characterization on the basis of cytochalasin B binding. J Biol Chem. 1978; 253(19): 6923-6930. [PubMed Abstract]
- Mueckler M, Caruso C, Baldwin SA, Panico M, Blench I, Morris HR, Allard WJ, Lienhard GE, Lodish HF. Sequence and structure of a human glucose transporter. Science. 1985; 229(4717): 941-945. [CrossRef] [PubMed Abstract]
- Baldwin SA, Lienhard GE. Purification and reconstitution of glucose transporter from human erythrocytes. Methods Enzymol. 1989; 174: 39-50. [CrossRef] [PubMed Abstract]
- Barnett JE, Holman GD, Munday KA. Structural requirements for binding to the sugar transport system of the human erythrocyte. Biochem J. 1973; 131(2): 211-221.[PubMed Abstract]
- Leitch JM, Carruthers A. Alpha- and beta-monosaccharide transport in human erythrocytes. Am J Physiol Cell Physiol. 2009; 296: C151-C161. [PubMed Abstract]
- Bachelard HS. Deoxyglucose and brain glycolysis. Biochem J. 1972; 127(5): 83P.[PubMed Abstract]
- Jay TM, Dienel GA, Cruz NF, Mori K, Nelson T, Sokoloff L. Metabolic stability of 3-O-methyl-D-glucose in brain and other tissues. J Neurochem. 1990; 55(3): 989-1000.[CrossRef] [PubMed Abstract]
- Keller K, Strube M, Mueckler M. Functional expression of the human HepG2 and rat adipocyte glucose transporters in Xenopus oocytes. Comparison of kinetic parameters. J Biol Chem. 1989; 264(32): 18884-18889. [PubMed Abstract]
- Gould GW, Lienhard GE. Expression of a functional glucose transporter in Xenopus oocytes. Biochemistry. 1989; 28(24), 9447-9452. [CrossRef] [PubMed Abstract]
- Vera JC, Rosen OM. Functional expression of mammalian glucose transporters in Xenopus laevis oocytes: evidence for celldependent insulin sensitivity. Mol Cell Biol. 1989; 9(10): 4187-4195. [PubMed Abstract]
- Nishimura H, Pallardo FV, Seidner GA, Vannucci S, Simpson IA, Birnbaum MJ. Kinetics of GLUT1 and GLUT4 glucose transporters expressed in Xenopus oocytes. J Biol Chem. 1993; 268(12): 8514-8520. [PubMed Abstract]
- Wheeler TJ, Hinkle PC. Kinetic properties of the reconstituted glucose transporter from human erythrocytes. J Biol Chem. 1981; 256(17): 8907-8914. [PubMed Abstract]
- Lowe AG, Walmsley AR. The kinetics of glucose transport in human red blood cells. Biochim Biophys Acta. 1986; 857(2): 146-154. [CrossRef] [PubMed Abstract]
- Wheeler TJ, Cole D, Hauck MA. Characterization of glucose transport activity reconstituted from heart and other tissues. Biochim Biophys Acta. 1998; 1414(1-2): 217-230. [CrossRef] [PubMed Abstract]
- KC S, Cárcamo JM, Golde DW. Vitamin C enters mitochondria via facilitative glucose transporter 1 (Glut1) and confers mitochondrial protection against oxidative injury. FASEB J. 2005; 19(12): 1657-1667. [CrossRef] [PubMed Abstract]
- Bloch R. Inhibition of glucose transport in the human erythrocyte by cytochalasin B. Biochemistry. 1973; 12: 4799-4801. [CrossRef] [PubMed Abstract]
- Basketter DA, Widdas WF. Asymmetry of the hexose transfer system in human erythrocytes. Comparison of the effects of cytochalasin B, phloretin and maltose as competitive inhibitors. J Physiol. 1978; 278: 389-401.[CrossRef] [PubMed Abstract]
- Sergeant S, Kim HD. Inhibition of 3-O-methylglucose transport in human erythrocytes by forskolin. J Biol Chem. 1985; 260: 14677-14682. [PubMed Abstract]
- Martin HJ, Kornmann F, Fuhrmann GF. The inhibitory effects of flavonoids and antiestrogens on the Glut1 glucose transporter in human erythrocytes. Chem Biol Interact. 2003; 146(3): 225-235. [CrossRef] [PubMed Abstract]
- Robichaud T, Appleyard AN, Herbert RB, Henderson PJ, Carruthers A. Determinants of ligand binding affinity and cooperativity at the GLUT1 endofacial site. Biochemistry. 2011; 50(15): 3137-3148. [CrossRef] [PubMed Abstract]
- Moreland JL, Gramada A, Buzko OV, Zhang Q, Bourne PE. The Molecular Biology Toolkit (MBT): a modular platform for developing molecular visualization applications. BMC Bioinformatics. 2005; 6: 21. [PubMed Abstract]
- Deng D, Xu C, Sun P, Wu J, Yan C, Hu M, Yan N. Crystal structure of the human glucose transporter GLUT1. Nature. 2014; 510(7503): 121-125. [CrossRef] [PubMed Abstract]
- Sun L, Zeng X, Yan C, Sun X, Gong X, Rao Y, Yan N. Crystal structure of a bacterial homologue of glucose transporters GLUT1-4. Nature. 2012; 490(7420): 361-366.[CrossRef] [PubMed Abstract]
- Bell GI, Fukumoto H, Burant CF, Seino S, Sivitz WI, Pessin JE. Facilitative glucose transport proteins: structure and regulation of expression in adipose tissue. Int J Obes. 1991; 15(2): 127-132. [PubMed Abstract]
- Gherzi R, Melioli G, de Luca M, D’Agostino A, Distefano G, Guastella M, D’Anna F, Franzi AT, Cancedda R. “HepG2/erythroid/brain” type glucose transporter (GLUT1) is highly expressed in human epidermis: keratinocyte differentiation affects GLUT1 levels in reconstituted epidermis. J Cell Physiol. 1992; 150(3): 463-474. [CrossRef] [PubMed Abstract]
- Kahn BB. Dietary regulation of glucose transporter gene expression: tissue specific effects in adipose cells and muscle. J Nutr. 1994; 124(8): 1289S-1295S. [CrossRef] [PubMed Abstract]
- Camps M, Vilaro S, Testar X, Palacín M, Zorzano A. High and polarized expression of GLUT1 glucose transporters in epithelial cells from mammary gland: acute down-regulation of GLUT1 carriers by weaning. Endocrinology. 1994; 134(2): 924-934.[PubMed Abstract]
- Klip A, Tsakiridis T, Marette A, Ortiz PA. Regulation of expression of glucose transporters by glucose: a review of studies in vivo and in cell cultures. FASEB J. 1994; 8(1): 43-53. [PubMed Abstract]
- Mann GE, Yudilevich DL, Sobrevia L. Regulation of amino acid and glucose transporters in endothelial and smooth muscle cells. Physiol Rev. 2003; 83(1): 183-252. [PubMed Abstract]
- Montessuit C, Lerch R. Regulation and dysregulation of glucose transport in cardiomyocytes. Biochim Biophys Acta. 2013; 1833(4): 848-856. [CrossRef] [PubMed Abstract]
- Montel-Hagen A, Blanc L, Boyer-Clavel M, Jacquet C, Vidal M, Sitbon M, Taylor N. The Glut1 and Glut4 glucose transporters are differentially expressed during perinatal and postnatal erythropoiesis. Blood. 2008; 112(12): 4729-4738. [CrossRef] [PubMed Abstract]
- Gorga FR, Lienhard GE. Changes in the intrinsic fluorescence of the human erythrocyte monosaccharide transporter upon ligand binding. Biochemistry. 1982; 21(8): 1905-1908. [CrossRef] [PubMed Abstract]
- Baldwin SA, Baldwin JM, Lienhard GE. Monosaccharide transporter of the human erythrocyte. Characterization of an improved preparation. Biochemistry. 1982; 21(16): 3836-3842. [CrossRef] [PubMed Abstract]
- Boulter JM, Wang DN. Purification and characterization of human erythrocyte glucose transporter in decylmaltoside detergent solution. Protein Expr Purif. 2001; 22(2): 337-348. [CrossRef] [PubMed Abstract]
- Kuzawa CW, Chugani HT, Grossman LI, Lipovich L, Muzik O, Hof PR, et al. Metabolic costs and evolutionary implications of human brain development. Proc Natl Acad Sci U S A. 2014; 111(36): 13010-13015. [CrossRef] [PubMed Abstract]
- De Vivo DC, Trifiletti RR, Jacobson RI, Ronen GM, Behmand RA, Harik SI. Defective glucose transport across the blood-brain barrier as a cause of persistent hypoglycorrhachia, seizures, and developmental delay. New Eng J Med. 1991; 325(10): 703-709. [CrossRef] [PubMed Abstract]
- Wang BY, Kalir T, Sabo E, Sherman DE, Cohen C, Burstein DE. Immunohis tochemical staining of GLUT1 in benign, hyperplastic and malignant endometrial epithelia. Cancer. 2000; 88(12): 2774-2781. [PubMed Abstract]
- Klepper J, Voit T. Facilitated glucose transporter protein type 1 (GLUT1) deficiency syndrome: impaired glucose transport into brain – a review. Eur J Pediatr. 2002; 161(6): 295-304. [CrossRef] [PubMed Abstract]
- De Giorgis V, Veggiotti P. GLUT1 deficiency syndrome 2013: current state of the art. Seizure. 2013; 22(10): 803-811. [CrossRef] [PubMed Abstract]
- Pearson TS, Akman C, Hinton VJ, Engelstad K, De Vivo DC. Phenotypic spectrum of glucose transporter type 1 deficiency syndrome (Glut1 DS). Curr Neurol Neurosci Rep. 2013; 13(4): 342. [CrossRef] [PubMed Abstract]
- Ragona F, Matricardi S, Castellotti B, Patrini M, Freri E, Binelli S, et al. Refractory absence epilepsy and glut1 deficiency syndrome: a new case report and literature review. Neuropediatrics. 2014; 45(5): 328-332. [CrossRef] [PubMed Abstract]
- Leen WG, Taher M, Verbeek MM, Kamsteeg EJ, van de Warrenburg BP, Willemsen MA. GLUT1 deficiency syndrome into adulthood: a follow-up study. J Neurol. 2014; 261(3): 589-599. [CrossRef] [PubMed Abstract]
- Gras D, Roze E, Caillet S, Méneret A, Doummar D, Billette de Villemeur T, Vidailhet M, Mochel F. GLUT1 deficiency syndrome: an update. Rev Neurol (Paris). 2014; 170(2): 91-99. [CrossRef] [PubMed Abstract]
- Suls A, Mullen SA, Weber YG, Verhaert K, Ceulemans B, Guerrini R, et al. Early-onset absence epilepsy caused by mutations in the glucose transporter GLUT1. Ann Neurol. 2009; 66(3): 415-419. [CrossRef] [PubMed Abstract]
- Arsov T, Mullen SA, Damiano JA, Lawrence KM, Huh LL, Nolan M, et al. Early onset absence epilepsy: 1 in 10 cases is caused by GLUT1 deficiency. Epilepsia. 2012; 53(12): e204-e207. [CrossRef] [PubMed Abstract]
- Striano P, Weber YG, Toliat MR, Schubert J, Leu C, Chaimana R, et al. GLUT1 mutations are a rare cause of familial idiopathic generalized epilepsy. Neurology. 2012; 78(8): 557-562. [CrossRef] [PubMed Abstract]
- Weber YG, Kamm C, Suls A, Kempfle J, Kotschet K, Schüle R, et al. Paroxysmal choreoathetosis/spasticity (DYT9) is caused by a GLUT1 defect. Neurology. 2011; 77(10): 959-964. [CrossRef] [PubMed Abstract]
- Weber YG, Storch A, Wuttke TV, Brockmann K, Kempfle J, Maljevic S, et al. GLUT1 mutations are a cause of paroxysmal exertion-induced dyskinesias and induce hemolytic anemia by a cation leak. J Clin Invest. 2008; 118(6): 2157-2168.[CrossRef] [PubMed Abstract]
- Younes M, Lechago LV, Somoano JR, Mosharaf M, Lechago J. Wide expression of the human erythrocyte glucose transporter Glut1 in human cancers. Cancer Res. 1996; 56(5): 1164-1167. [PubMed Abstract]
- Nishioka T, Oda Y, Seino Y, Yamamoto T, Inagaki N, Yano H, et al. Distribution of the glucose transporters in human brain tumors. Cancer Res. 1992; 52(14): 3972-3979.[PubMed Abstract]
- Brown RS, Wahl RL. Overexpression of GLUT-1 glucose transporter in human breast cancer: an immunohistochemical study. Cancer. 1993; 72(10): 2979-2985.[CrossRef] [PubMed Abstract]
- Rudlowski C, Moser M, Becker AJ, Rath W, Buttner R, Schroder W, Schurmann A. GLUT1 mRNA and protein expression in ovarian borderline tumors and cancer. Oncology. 2004; 66(5): 404-410. [CrossRef] [PubMed Abstract]
- Haber RS, Rathan A, Weiser KR, Pritsker A, Itzkowitz SH, Bodian, et al. GLUT-1 glucose transporter expression in colorecta l carcinoma: a marker for poor prognosis. Cancer. 1998; 83(1): 34-40. [PubMed Abstract]
- Baer SC, C asaubon L, Younes M. Expression of the human erythrocyte glucose transporter GLUT-1 in cutaneous neoplasia. J Am Acad Dermatol. 1997; 37(4): 575-577. [PubMed Abstract]
- Wang BY, Kalir T, Sabo E, Sherman DE, Cohen C, Burstein DE. Immunohistochemical staining of GLUT1 in benign, hyperplastic and malignant endometrial epithelia. Cancer. 2000; 88(12):2774-2781. [CrossRef] [PubMed Abstract]
- Tohma T, Okazumi S, Makino H, Cho A, Mochizuki R, Shuto K, et al. Overexpression of glucose transporter 1 in esophageal squamous cell carcinomas: a marker for poor prognosis. Dis Esophagus. 2005; 18(3): 185-189. [CrossRef] [PubMed Abstract]
- Amann T, Maegdefrau U, Hartmann A, Agaimy A, Marienhagen J, Weiss TS, et al. GLUT1 expression is increased in hepatocellular carcinoma and promotes tumorigenesis. Am J Pathol. 2009; 174(4): 1544-1552. [CrossRef] [PubMed Abstract]
- Ogawa J, I noue H, Koide S. Glucose-transporter-type-I-gene amplification correlates with sialyl-Lewis-X synthesis and proliferation in lung cancer. Int J Cancer. 1997; 74(2): 189-192. [CrossRef] [PubMed Abstract]
- Fukuzumi M, Hamakawa H, Onishi A, Sumida T, Tanioka H. Gene expression of GLUT isoforms and VHL in oral squamous cell carcinoma. Cancer Lett. 2000; 161(2): 133-140. [CrossRef] [PubMed Abstract]
- Cantuaria G, Fagotti A, Ferrandina G. GLUT-1 expression in ovarian carcinoma: association with survival and response to chemotherapy. Cancer. 2001; 92(5): 1144-1150. [CrossRef] [PubMed Abstract]
- Sung JY, Kim GY, Lim SJ, Park YK, Kim YW. Expression of the GLUT1 glucose transporter and p53 in carcinomas of the pancreatobiliary tract. Pathol Res Pract. 2010; 206(1): 24-29. [CrossRef] [PubMed Abstract]
- Chandler JD, Williams ED, Slavin JL, Best JD, Rogers S. Expression and localization of GLUT1 and GLUT12 in prostate carcinoma. Cancer. 2003; 97(8): 2035-2042. [CrossRef] [PubMed Abstract]
- Nagase Y, Takata K, Moriyama N, Aso Y, Murakami T, Hirano H. Immunohistochemical localization of glucose transporters in human renal cell carcinoma. J Urol. 1995; 153(3): 798-801. [PubMed Abstract]
- Rempel A, Bannasch P, Mayer D. Differences in expression and intracellular distribution of hexokinase isoenzymes in rat liver cells of different transformation stages. Biochim Biophys Acta. 1994; 1219(3): 660-668. [CrossRef] [PubMed Abstract]
- Mathupala SP, Rempel A, Pedersen PL. Glucose catabolism in cancer cells. Isolation, sequence, and activity of the promoter for type II hexokinase. J Biol Chem. 1995; 270(28): 16918-16925. [CrossRef] [PubMed Abstract]
- Warburg O, Posener K, Negelein E: Uber den stoffwechsel der carcinomzelle. Biochem Z. 1924; 152: 309-344. [CrossRef]
- Warburg O. On the origin of cancer cells. Science. 1956; 123(3191): 309-314.[PubMed Abstract]
- Gatenby RA, Gillies RJ. Why do cancers have high aerobic glycolysis? Nat Rev Cancer. 2004; 4(11): 891-899. [CrossRef] [PubMed Abstract]
- Hsu PP, Sabatini DM. Cancer cell metabolism: Warburg and beyond. Cell. 2008; 134(5): 703-707. [CrossRef] [PubMed Abstract]
- Vander Heiden MG, Cantley LC, Thompson CB. Understanding the Warburg effect: the metabolic requirements of cell proliferation. Science. 2009; 324(5930): 1029-1033.[CrossRef] [PubMed Abstract]
- Lunt SY, Vander Heiden MG. Aerobic glycolysis: meeting the metabolic requirements of cell proliferation. Annu Rev Cell Dev Biol. 2011; 27: 441-464. [CrossRef] [PubMed Abstract]
- Fanti S, Farsad M, Mansi L. Normal distribution of FDG In: Atlas of PET/CT – A quick guide to image interpretation. Berlin Heidelberg: Springer; 2009:1-23. [Reference Source]
- Ido T, Wan CN, Casella V, Fowler JS, Wolf AP, Reivich M, et al. Labeled 2-deoxy-D-glucose analogs: 18F-labeled 2-deoxy-2-fluoro-D-glucose, 2-deoxy-2-fluoro-D-mannose and 14C-2-deoxy-2-fluoro-D-glucose. J Labeled Compounds Radiopharm. 1978; 14(2): 175-183. [CrossRef]
- Hamacher K, Coenen HH, Stocklin G. Efficient stereospecific synthesis of no-carrier-added 2-[18F]-fluoro-2-deoxy-D-glucose using aminopolyether supported nucleophilic substitution. J Nucl Med. 1986; 27(2): 235-238. [PubMed Abstract]
- Fowler JS, Ido T. Initial and subsequent approach for the synthesis of 18FDG. Semin Nucl Med. 2002; 32(1): 6-12. [CrossRef] [PubMed Abstract]
- Yu S. Review of 18F-FDG synthesis and quality control. Biomed Imaging Interv J. 2006; 2(4): e57. [CrossRef] [PubMed Abstract]
- Richards ML, Scott PJH (2012). Synthesis of [18F]-fluorodeoxyglucose ([18F]FDG) In: Scott PJH, Hockley BG, eds. Radiochemical syntheses: Radiopharmaceuticals for positron emission tomography, Volume 1. Hoboken, NJ, USA: John Wiley & Sons, Inc.; 2012. [Reference Source]
- Avril N. GLUT1 expression in tissue and (18)F-FDG uptake. J Nucl Med. 2004; 45(6): 930-932. [PubMed Abstract]
- Mun J. Radiofluorinated carbohydrates for positron emission tomography. Curr Top Med Chem. 2013; 13(8): 944-950. [CrossRef] [PubMed Abstract]
- Abouzied MM, Crawford ES, Nabi HA. 18F-FDG imaging: pitfalls and artifacts. J Nucl Med Technol. 2005; 33(3): 145-155. [PubMed Abstract]
- Kubota K. From tumor biology to clinical Pet: a review of positron emission tomography (PET) in oncology. Ann Nucl Med. 2001; 15(6): 471-486. [CrossRef] [PubMed Abstract]
- Macheda ML, Rogers S, Best JD. Molecular and cellular regulation of glucose transporter (GLUT) proteins in cancer. J Cell Physiol. 2005; 202(3): 654-662.[CrossRef] [PubMed Abstract]
- Porporato PE, Dhup S, Dadhich RK, Copetti T, Sonveaux P. Anticancer targets in the glycolytic metabolism of tumors: a comprehensive review. Front Pharmacol. 2011; 2: 49. [CrossRef] [PubMed Abstract]
- Andersen AP, Moreira JM, Pedersen SF. Interactions of ion transporters and channels with cancer cell metabolism and the tumour microenvironment. Philos Trans R Soc Lond B Biol Sci. 2014; 369(1638): 20130098. [CrossRef] [PubMed Abstract]
- Cancer Research UK.
- Acker MR, Burrell SC. Utility of 18F-FDG PET in evaluating cancers of lung. J Nucl Med Technol. 2005; 33(2): 69-74. [PubMed Abstract]
- Kaira K, Serizawa M, Koh Y, Takahashi T, Yamaguchi A, Hanaoka H, et al. Biological significance of 18F-FDG uptake on PET in patients with non-small-cell lung cancer. Lung Cancer. 2014; 83(2): 197-204. [CrossRef] [PubMed Abstract]
- Usuda K, Sagawa M, Aikawa H, Ueno M, Tanaka M, Machida Y, et al. Correlation between glucose transporter-1 expression and 18F-fluoro-2-deoxyglucose uptake on positron emission tomography in lung cancer. Gen Thorac Cardiovasc Surg. 2010; 58(8): 405-410. [CrossRef] [PubMed Abstract]
- Zhou X, Chen R, Xie W, Ni Y, Liu J, Huang G. Relationship between 18F-FDG accumulation and lactate dehydrogenase a expression in lung adenocarcinomas. J Nucl Med. 2014; 55(11): 1766-1771. [CrossRef] [PubMed Abstract]
- Riely GJ, Marks J, Pao W. KRAS mutations in non–small cell lung cancer. Proc Am Thorac Soc. 2009; 6(2): 201-205. [PubMed Abstract]
- Sasaki H, Shitara M, Yokota K, Hikosaka Y, Moriyama S, Yano M, et al. Overexpression of GLUT1 correlates with Kras mutations in lung carcinomas. Mol Med Rep. 2012; 5(3): 599-602. [CrossRef] [PubMed Abstract]
- Niikura N, Ueno NT. The role of F-FDG-positron emission tomography/computed tomography in staging primary breast cancer. J Cancer. 2010; 1: 51-53. [PubMed Abstract]
- Robertson IJ, Hand F, Kell MR. FDG-PET/CT in the staging of local/regional metastases in breast cancer. Breast. 2011; 20(6): 491-494. [CrossRef] [PubMed Abstract]
- Ulaner GA, Eaton A, Morris PG, Lilienstein J, Jhaveri K, Patil S, et al. Prognostic value of quantitative fluorodeoxyglucose measurements in newly diagnosed metastatic breast cancer. Cancer Med. 2013; 2(5): 725-733. [CrossRef] [PubMed Abstract]
- Riedl CC, Slobod E, Jochelson M, Morrow M, Goldman DA, Gonen M, et al. Retrospective analysis of 18F-FDG PET/CT for staging asymptomatic breast cancer patients younger than 40 years. J Nucl Med. 2014; 55(10): 1578-1583. [CrossRef] [PubMed Abstract]
- Kamaleshwaran KK, Natarajan S, Rajan F, Mohanan V, Shinto AS. Image findings of a rare case of gestational breast cancer diagnosed in a lactating woman with Fluorine-18 fluorodeoxyglucose-positron emission tomography/computed tomography. Onc Gas Hep Rep. 2014; 3: 34-35. [CrossRef]
- Buck AK, Schirrmeister H, Mattfeldt T, Reske SN. Biological characterisation of breast cancer by means of PET. Eur J Nucl Med Mol Imaging. 2004; 31(1): S80-S87.[CrossRef] [PubMed Abstract]
- Groves AM, Shastry M, Rodriguez-Justo M, Malhotra A, Endozo R, Davidson T, et al. 18F-FDG PET and biomarkers for tumour angiogenesis in early breast cancer. Eur J Nucl Med Mol Imaging. 2011; 38(1): 46-52. [CrossRef] [PubMed Abstract]
- Grabellus F, Sheu SY, Bachmann HS, Lehmann N, Otterbach F, Heusner TA, et al. The XbaI G>T polymorphism of the glucose transporter 1 gene modulates 18F-FDG uptake and tumor aggressiveness in breast cancer. J Nucl Med. 2010; 51(8): 1191-1197.[CrossRef] [PubMed Abstract]
- Ng DP, Canani L, Araki S, Smiles A, Moczulski D, Warram JH, et al. Minor effect of GLUT1 polymorphisms on susceptibility to diabetic nephropathy in type 1 diabetes. Diabetes. 2002; 51(7): 2264-2269. [CrossRef] [PubMed Abstract]
- Smith TA, Appleyard MV, Sharp S, Fleming IN, Murray K, Thompson AM. Response to trastuzumab by HER2 expressing breast tumour xenografts is accompanied by decreased hexokinase II, glut1 and [18F]-FDG incorporation and changes in 31P-NMR-detectable phosphomonoesters. Cancer Chemother Pharmacol. 2013; 71(2): 473-480.[CrossRef] [PubMed Abstract]
- Wiering B, Ruers TJ, Oyen WJ. Role of FDG-PET in the diagnosis and treatment of colorectal liver metastases. Expert Rev Anticancer Ther. 2004; 4(4): 607-613.[CrossRef] [PubMed Abstract]
- Gu J, Yamamoto H, Fukunaga H, Danno K, Takemasa I, Ikeda M, et al. Correlation of GLUT-1 overexpression, tumor size, and depth of invasion with 18F-2-fluoro-2-deoxy-D-glucose uptake by positron emission tomography in colorectal cancer. Dig Dis Sci. 2006; 51(12): 2198-2205. [CrossRef] [PubMed Abstract]
- Shen YM, Arbman G, Olsson B, Sun XF. Overexpression of GLUT1 in colorectal cancer is independently associated with poor prognosis. Int J Biol Markers. 2011; 26(3): 166-172. [CrossRef] [PubMed Abstract]
- Izuishi K, Yamamoto Y, Sano T, Takebayashi R, Nishiyama Y, Mori H, et al. Molecular mechanism underlying the detection of colorectal cancer by 18F-2-fluoro-2-deoxy-D-glucose positron emission tomography. J Gastrointest Surg. 2012; 16(2): 394-400.[CrossRef] [PubMed Abstract]
- Chung FY, Huang MY, Yeh CS, Chang HJ, Cheng TL, Yen LC, et al. GLUT1 gene is a potential hypoxic marker in colorectal cancer patients. BMC Cancer. 2009; 9: 241.[CrossRef] [PubMed Abstract]
- Kawada K, Nakamoto Y, Kawada M, Hida K, Matsumoto T, Murakami T, et al. Relationship between 18F-fluorodeoxyglucose accumulation and KRAS/BRAF mutations in colorectal cancer. Clin Cancer Res. 2012; 18(6): 1696-1703. [CrossRef] [PubMed Abstract]
- Phipps AI, Buchanan DD, Makar KW, Win AK, Baron JA, Lindor NM, et al. KRAS-mutation status in relation to colorectal cancer survival: the joint impact of correlated tumour markers. Br J Cancer. 2013; 108(8): 1757-1764.[CrossRef] [PubMed Abstract]
- Iwamoto M, Kawada K, Nakamoto Y, Itatani Y, Inamoto S, Toda K, et al. Regulation of 18F-FDG accumulation in colorectal cancer cells with mutated KRAS. J Nucl Med. 2014; 55(12): 2038-2044. [CrossRef] [PubMed Abstract]
- Takahashi N, Inoue T, Lee J, Yamaguchi T, Shizukuishi K. The roles of PET and PET/CT in the diagnosis and management of prostate cancer. Oncology. 2007; 72(3-4): 226-233. [CrossRef] [PubMed Abstract]
- Reinicke K, Sotomayor P, Cisterna P, Delgado C, Nualart F, Godoy A. Cellular distribution of Glut-1 and Glut-5 in benign and malignant human prostate tissue. J Cell Biochem. 2012; 113(2): 553-562. [CrossRef] [PubMed Abstract]
- Jans J, van Dijk JH, van Schelven S, van der Groep P, Willems SH, Jonges TN, et al. Expression and localization of hypoxia proteins in prostate cancer: prognostic implications after radical prostatectomy. Urology. 2010; 75(4): 786-792. [CrossRef] [PubMed Abstract]
- Vaz CV, Alves MG, Marques R, Moreira PI, Oliveira PF, Maia CJ, et al. Androgen-responsive and nonresponsive prostate cancer cells present a distinct glycolytic metabolism profile. Int J Biochem Cell Biol. 2012; 44(11): 2077-2084. [CrossRef][PubMed Abstract]
- Gonzalez-Menendez P, Hevia D, Rodriguez-Garcia A, Mayo JC, Sainz RM. Regulation of GLUT transporters by flavonoids in androgen-sensitive and -insensitive prostate cancer cells. Endocrinology. 2014; 155(9): 3238-3250. [CrossRef] [PubMed Abstract]
- Al-Nahhas A, Khan S, Gogbashian A, Banti E, Rampin L, Rubello D. Review. 18F-FDG PET in the diagnosis and follow-up of thyroid malignancy. In Vivo. 2008; 22(1): 109-114. [PubMed Abstract]
- Mosci C, Iagaru A. PET/CT imaging of thyroid cancer. Clin Nucl Med. 2011; 36(12): e180-e185. [CrossRef] [PubMed Abstract]
- de Geus-Oei LF, Pieters GF, Bonenkamp JJ, Mudde AH, Bleeker-Rovers CP, Corstens FH, et al. 18F-FDG PET reduces unnecessary hemithyroidectomies for thyroid nodules with inconclusive cytologic results. J Nucl Med. 2006; 47(5): 770-775. [PubMed Abstract]
- Schönberger J, Rüschoff J, Grimm D, Marienhagen J, Rümmele P, Meyringer R, et al. Glucose transporter 1 gene expression is related to thyroid neoplasms with an unfavorable prognosis: an immunohistochemical study. Thyroid. 2002; 12(9): 747-754. [PubMed Abstract]
- Grabellus F, Nagarajah J, Bockisch A, Schmid KW, Sheu SY. Glucose transporter 1 expression, tumor proliferation, and iodine/glucose uptake in thyroid cancer with emphasis on poorly differentiated thyroid carcinoma. Clin Nucl Med. 2012; 37(2): 121-127. [CrossRef] [PubMed Abstract]
- Yin Y, Shen WH. PTEN: a new guardian of the genome. Oncogene. 2008; 27(41): 5443-5453. [CrossRef] [PubMed Abstract]
- Morani F, Pagano L, Prodam F, Aimaretti G, Isidoro C. Loss of expression of the oncosuppressor PTEN in thyroid incidentalomas associates with GLUT1 plasmamembrane expression. Panminerva Med. 2012; 54(2): 59-63. [PubMed Abstract]
- Morani F, Phadngam S, Follo C, Titone R, Aimaretti G, Galetto A, et al. PTEN regulates plasma membrane expression of glucose transporter 1 and glucose uptake in thyroid cancer cells. J Mol Endocrinol. 2014; 53(2): 247-258. [CrossRef] [PubMed Abstract]
- Zhang Y. Epidemiology of esophageal cancer. World J Gastroenterol. 2013; 19(34): 5598-5606. [CrossRef] [PubMed Abstract]
- van Westreenen HL, Cobben DC, Jager PL, van Dullemen HM, Wesseling J, Elsinga PH, et al. Comparison of 18F-FLT PET and 18F-FDG PET in esophageal cancer. J Nucl Med. 2005; 46(3): 400-404. [PubMed Abstract]
- Tohma T, Okazumi S, Makino H, Cho A, Mochiduki R, Shuto K, et al. Relationship between glucose transporter, hexokinase and FDG-PET in esophageal cancer. Hepatogastroenterology. 2005; 52(62): 486-490. [PubMed Abstract]
- Hiyoshi Y, Watanabe M, Imamura Y, Nagai Y, Baba Y, Yoshida N, et al. The relationship between the glucose transporter type 1 expression and F-fluorodeoxyglucose uptake in esophageal squamous cell carcinoma. Oncology. 2009; 76(4): 286-292.[CrossRef] [PubMed Abstract]
- Sawayama H, Ishimoto T, Watanabe M, Yoshida N, Baba Y, Sugihara H, et al. High expression of glucose transporter 1 on primary lesions of esophageal squamous cell carcinoma is associated with hematogenous recurrence. Ann Surg Oncol. 2014; 21(5): 1756-1762. [CrossRef] [PubMed Abstract]
- Takebayashi R, Izuishi K, Yamamoto Y, Kameyama R, Mori H, Masaki T, et al. [18F]Fluorodeoxyglucose accumulation as a biological marker of hypoxic status but not glucose transport ability in gastric cancer. J Exp Clin Cancer Res. 2013; 32: 34.[CrossRef] [PubMed Abstract]
- Kamimura K, Nakajo M. PET Imaging in gastric carcinoma, management of gastric cancer In: Ismaili N, ed. InTech ISBN: 978-953-307-344-6, DOI: 10.5772/21475.
- Kim JJ, Campos NG, O’Shea M, Diaz M, Mutyaba I. Model-based impact and cost-effectiveness of cervical cancer prevention in sub-Saharan Africa. Vaccine. 2013; 31(5): F60-F72. [CrossRef] [PubMed Abstract]
- Park SI, Suh DS, Kim SJ, Choi KU, Yoon MS. Correlation between biological marker expression and F-fluorodeoxyglucose uptake in cervical cancer measured by positron emission tomography. Onkologie. 2013; 36(4): 169-174. [PubMed Abstract]
- Nakajo M, Kajiya Y, Tani A, Yoneda S, Shirahama H, Higashi M, et al. 18FDG PET for grading malignancy in thymic epithelial tumors: significant differences in ¹⁸FDG uptake and expression of glucose transporter-1 and hexokinase II between low and high-risk tumors: preliminary study. Eur J Radiol. 2012; 81(1): 146-151. [PubMed Abstract]
- Otsuka H. The utility of FDG-PET in the diagnosis of thymic epithelial tumors. J Med Invest. 2012; 59(3-4): 225-34. [CrossRef] [PubMed Abstract]
- Le Roux PY, Gastinne T, Le Gouill S, Nowak E, Bodet-Milin C, Querellou S, et al. Prognostic value of interim FDG PET/CT in Hodgkin’s lymphoma patients treated with interim response-adapted strategy: comparison of International Harmonization Project (IHP), Gallamini and London criteria. Eur J Nucl Med Mol Imaging. 2011; 38(6): 1064-1071. [CrossRef] [PubMed Abstract]
- Gallamini A, Kostakoglu L. Interim FDG-PET in Hodgkin lymphoma: a compass for a safe navigation in clinical trials? Blood. 2012; 120(25): 4913-4920. [CrossRef] [PubMed Abstract]
- Shim HK, Lee WW, Park SY, Kim H, Kim SE: Relationship between FDG uptake and expressions of glucose transporter type 1, type 3, and hexokinase-II in Reed-Sternberg cells of Hodgkin lymphoma. Oncol Res. 2009; 17(7): 331-337. [CrossRef] [PubMed Abstract]
- Shim HK, Lee WW, Park SY, Kim H, So Y, Kim SE: Expressions of glucose transporter Types 1 and 3 and hexokinase-II in diffuse large B-cell lymphoma and other B-cell non-Hodgkin’s lymphomas. Nucl Med Biol. 2009; 36(2): 191-197. [CrossRef] [PubMed Abstract]
- Hartmann S, Agostinelli C, Diener J, Döring C, Fanti S, Zinzani PL, et al. GLUT1 expression patterns in different Hodgkin lymphoma subtypes and progressively transformed germinal centers. BMC Cancer. 2012; 12: 586. [CrossRef] [PubMed Abstract]
- Gao H, Jiang X. Progress on the diagnosis and evaluation of brain tumors. Cancer Imaging. 2013; 13(4): 466-481. [CrossRef] [PubMed Abstract]
- Madhok BM, Yeluri S, Perry SL, Hughes TA, Jayne DG. Targeting glucose metabolism: an emerging concept for anticancer therapy. Am J Clin Oncol. 2011; 34(6): 628-635.[CrossRef] [PubMed Abstract]
- Vander Heiden MG. Targeting cancer metabolism: a therapeutic window opens. Nat Rev Drug Discov. 2011; 10(9): 671-684. [CrossRef] [PubMed Abstract]
- Hamanaka RB, Chandel NS. Targeting glucose metabolism for cancer therapy. J Exp Med. 2012; 209(2): 211-215. [CrossRef] [PubMed Abstract]
- Zhang Y, Yang JM. Altered energy metabolism in cancer: a unique opportunity for therapeutic intervention. Cancer Biol Ther. 2013; 14(2): 81-89. [CrossRef] [PubMed Abstract]
- Ganapathy-Kanniappan S, Geschwind JF. Tumor glycolysis as a target for cancer therapy: progress and prospects. Mol Cancer. 2013; 12: 152. [CrossRef] [PubMed Abstract]
- Zhao Y, Butler EB, Tan M. Targeting cellular metabolism to improve cancer therapeutics. Cell Death Dis. 2013; 4: e532. [CrossRef] [PubMed Abstract]
- Talekar M, Boreddy SR, Singh A, Amiji M. Tumor aerobic glycolysis: new insights into therapeutic strategies with targeted delivery. Expert Opin Biol Ther. 2014; 14(8): 1145-1159. [CrossRef] [PubMed Abstract]
- Elf SE, Chen J. Targeting glucose metabolism in patients with cancer. Cancer. 2014; 120(6): 774-780. [CrossRef] [PubMed Abstract]
- Amann T, Hellerbrand C. GLUT1 as a therapeutic target in hepatocellular carcinoma. Expert Opin Ther Targets. 2009; 13(12): 1411-1427. [CrossRef] [PubMed Abstract]
- El-Gebali S, Bentz S, Hediger MA, Anderle P. Solute carriers (SLCs) in cancer. Mol Aspects Med. 2013; 34(2-3): 719-734. [PubMed Abstract]
- Rask-Andersen M, Masuram S, Fredriksson R, Schiöth HB. Solute carriers as drug targets: current use, clinical trials and prospective. Mol Aspects Med. 2013; 34(2-3): 702-710. [PubMed Abstract]
- Ulanovskaya OA, Cui J, Kron SJ, Kozmin SA. A pairwise chemical genetic screen identifies new inhibitors of glucose transport. Chem Biol. 2011; 18(2): 222-230.[CrossRef] [PubMed Abstract]
- Chan DA, Sutphin PD, Nguyen P, Turcotte S, Lai EW, Banh A, et al. Targeting GLUT1 and the Warburg effect in renal cell carcinoma by chemical synthetic lethality. Sci Transl Med. 2011; 3(94): 94ra70. [CrossRef] [PubMed Abstract]
- Zhang W, Liu Y, Chen X, Bergmeier SC. Novel inhibitors of basal glucose transport as potential anticancer agents. Bioorg Med Chem Lett. 2010; 20(7): 2191-2194.[CrossRef] [PubMed Abstract]
- Liu Y, Zhang W, Cao Y, Bergmeier S, Chen X. Small compound inhibitors of basal glucose transport inhibit cell proliferation and induce apoptosis in cancer cells via glucose-deprivation-like mechanisms. Cancer Lett. 2010; 298(2): 176-185. [CrossRef] [PubMed Abstract]
- Liu Y, Cao Y, Zhang W, Bergmeier S, Qian Y, Akbar H, et al. A small-molecule inhibitor of glucose transporter 1 downregulates glycolysis, induces cell-cycle arrest, and inhibits cancer cell growth in vitro and in vivo. Mol Cancer Ther. 2012; 11(8): 1672-1682. [CrossRef] [PubMed Abstract]
- Shibuya K, Okada M, Suzuki S, Seino M, Seino S, Takeda H, et al. Targeting the facilitative glucose transporter GLUT1 inhibits the self-renewal and tumor-initiating capacity of cancer stem cells. Oncotarget. 2015; 6(2): 651-661. [PubMed Abstract]
- Salas M, Obando P, Ojeda L, Ojeda P, Pérez A, Vargas-Uribe M, et al. Resolution of the direct interaction with and inhibition of the human GLUT1 hexose transporter by resveratrol from its effect on glucose accumulation. Am J Physiol Cell Physiol. 2013; 305(1): C90-C99. [CrossRef] [PubMed Abstract]
- Carter LG, D’Orazio JA, Pearson KJ. Resveratrol and cancer: focus on in vivo evidence. Endocr Relat Cancer. 2014; 21(3): R209-R225. [CrossRef] [PubMed Abstract]
- Jung KH, Lee JH, Thien Quach CH, Paik JY, Oh H, Park JW, et al. Resveratrol suppresses cancer cell glucose uptake by targeting reactive oxygen species-mediated hypoxia-inducible factor-1α activation. J Nucl Med. 2013; 54(12): 2161-2167. [PubMed Abstract]
- Gwak H, Haegeman G, Tsang BK, Song YS. Cancer-specific interruption of glucose metabolism by resveratrol is mediated through inhibition of Akt/GLUT1 axis in ovarian cancer cells. Mol Carcinog. 2014. [CrossRef]
- Young CD, Lewis AS, Rudolph MC, Ruehle MD, Jackman MR, Yun UJ, et al. Modulation of glucose transporter 1 (GLUT1) expression levels alters mouse mammary tumor cell growth in vitro and in vivo. PLoS One. 2011; 6(8): e23205. [CrossRef] [PubMed Abstract]
- Tai YF, Piccini P. Applications of positron emission tomography (PET) in neurology. J Neurol Neurosurg Psychiatry. 2004; 75(5): 669-676. [PubMed Abstract]
- Herholz K, Heiss WD. Positron emission tomography in clinical neurology. Mol Imaging Biol. 2004; 6(4): 239-269. [CrossRef] [PubMed Abstract]
- Kumar S, Rajshekher G, Prabhakar S. Positron emission tomography in neurological diseases. Neurol India. 2005; 53(2): 149-155. [CrossRef] [PubMed Abstract]
- Jacobs AH, Winkler A, Castro MG, Lowenstein P. Human gene therapy and imaging in neurological diseases. Eur J Nucl Med Mol Imaging. 2005; 32(2): S358-S383. [PubMed Abstract]
- Rueger MA, Kracht LW, Hilker R, Thiel A, Sobesky J, Winkeler A, et al. Role of in vivo imaging of the central nervous system for developing novel drugs. Q J Nucl Med Mol Imaging. 2007; 51(2): 164-181. [PubMed Abstract]
- Singhal T. Positron emission tomography applications in clinical neurology. Semin Neurol. 2012; 32(4): 421-431. [CrossRef] [PubMed Abstract]
- Catana C, Drzezga A, Heiss WD, Rosen BR. PET/MRI for neurologic applications. J Nucl Med. 2012; 53(12): 1916-1925. [CrossRef] [PubMed Abstract]
- Portnow LH, Vaillancourt DE, Okun MS. The history of cerebral PET scanning: from physiology to cutting-edge technology. Neurology. 2013; 80(10): 952-956.[CrossRef] [PubMed Abstract] Erratum in Neurology. 2013; 81(14): 1275. [PubMed Abstract]
- Jiang XF, Zhang T, Sy C, Nie BB, Hu XY, Ding Y. Dynamic metabolic changes after tomography (PET) study. Neurol Res. 2014; 36(5): 475-482. [PubMed Abstract]
- Alzheimer’s Association, Alzheimer’s disease facts and figures, Alzheimer’s & dementia, 2012, Volume 8, Issue 2. [Reference]
- Nobili F, Morbelli S. [18F]FDG-PET as a biomarker for early Alzheimer’s disease. The Open Nuclear Medicine Journal. 2010; 2: 46-52. [Reference Source]
- Mosconi L, Berti V, Glodzik L, Pupi A, De Santi S, de Leon MJ. Pre-clinical detection of Alzheimer’s disease using FDG-PET, with or without amyloid imaging. J Alzheimers Dis. 2010; 20(3): 843-854. [PubMed Abstract]
- Mosconi L, McHugh PF. FDG- and amyloid-PET in Alzheimer’s disease: is the whole greater than the sum of the parts? Q J Nucl Med Mol Imaging. 2011; 55(3): 250-264.[PubMed Abstract]
- Ishii K. PET approaches for diagnosis of dementia. AJNR Am J Neuroradiol. 2014; 35(11): 2030 -2038. [CrossRef] [PubMed Abstract]
- Perani D, Schillaci O, Padovani A, Nobili FM, Iaccarino L, Della Rosa PA, et al. A survey of FDG- and amyloid-PET imaging in dementia and GRADE analysis. Biomed Res Int. 2014; 2014: 785039. [CrossRef] [PubMed Abstract]
- Shokouhi S, Claassen D, Riddle W. Imaging brain metabolism and pathology in Alzheimer’s disease with positron emission tomography. J Alzheimers Dis Parkinsonism. 2014; 4(2): pii 143. [PubMed Abstract]
- Attwell D, Iadecola C. The neural basis of functional brain imaging signals. Trends Neurosci. 2002; 25(12): 621-625. [CrossRef] [PubMed Abstract]
- Silverman DHS, Small GW, Chang CY, Lu CS, Kung de Aburto MA, Chen W, et al. Positron emission tomography in evaluation of dementia: Regional brain metabolism and long-term outcome. JAMA. 2001; 286 (17): 2120-2127. [CrossRef] [PubMed Abstract]
- Mosconi L, Tsui WH, Herholz K, Pupi A, Drzezga A, Lucignani G, et al. Multi-center standardized FDG- PET diagnosis of Mild Cognitive Impairment, Alzheimer’s disease and other dementias. J Nucl Med. 2008; 49(3): 390-398. [PubMed Abstract]
- Jack CR Jr, Knopman DS, Jagust WJ, et al. Tracking pathophysiological processes in Alzheimer’s disease: an updated hypothetical model of dynamic biomarkers. The Lancet Neurology. 2013; 12(2): 207-216. [PubMed Abstract]
- Simpson IA, Chundu KR, Davies-Hill T, Honer WG, Davies P. Decreased concentrations of GLUT1 and GLUT3 glucose transporters in the brains of patients with Alzheimer’s disease. Ann Neurol. 1994; 35(5): 546-551. [CrossRef] [PubMed Abstract]
- Guo X, Geng M, Du G. Glucose transporter 1, distribution in the brain and in neural disorders: its relationship with transport of neuroactive drugs through the blood-brain barrier. Biochem Genet. 2005; 43(3-4): 175-187. [PubMed Abstract]
- Liu Y, Liu F, Iqbal K, Grundke-Iqbal I, Gong CX. Decreased glucose transporters correlate to abnormal hyperphosphorylation of tau in Alzheimer disease. FEBS Lett. 2008; 582(2): 359-364. [CrossRef] [PubMed Abstract]
- Juh R, Kim J, Moon D, Choe B, Suh T. Different metabolic patterns analysis of Parkinsonism on the 18F-FDG PET. Eur J Radiol. 2004; 51(3): 223-233. [PubMed Abstract]
- Feng T, Wang Y, Ouyang Q, Duan Z, Li W, Lu L, Xiang W. Comparison of cerebral glucose metabolism between multiple system atrophy Parkinsonian type and Parkinson’s disease. Neurol Res. 2008; 30(4): 377-382. [CrossRef] [PubMed Abstract]
- Kwon KY, Choi CG, Kim JS, Lee MC, Chung SJ. Diagnostic value of brain MRI and 18F-FDG PET in the differentiation of Parkinsonian-type multiple system atrophy from Parkinson’s disease. Eur J Neurol. 2008; 15(10): 1043-1049. [PubMed Abstract]
- Poston KL, Eidelberg D. FDG PET in the evaluation of Parkinson’s disease. PET Clin. 2010; 5(1): 55-64. [PubMed Abstract]
- Zhao P, Zhang B, Gao S. 18F-FDG PET study on the idiopathic Parkinson’s disease from several parkinsonian-plus syndromes. Parkinsonism Relat Disord. 2012; 18(1): S60-S62. [PubMed Abstract]
- Garraux G, Phillips C, Schrouff J, Kreisler A, Lemaire C, Degueldre C, et al. Multiclass classification of FDG PET scans for the distinction between Parkinson’s disease and atypical parkinsonian syndromes. Neuroimage Clin. 2013; 2: 883-893. [CrossRef] [PubMed Abstract]
- Tripathi M, Dhawan V, Peng S, Kushwaha S, Batla A, Jaimini A, et al. Differential diagnosis of parkinsonian syndromes using F-18 fluorodeoxyglucose positron emission tomography. Neuroradiology. 2013; 55(4): 483-492. [CrossRef] [PubMed Abstract]
- Huang C, Ravdin LD, Nirenberg MJ, Piboolnurak P, Severt L, Maniscalco JS, et al. Neuroimaging markers of motor and nonmotor features of Parkinson’s disease: an 18F fluorodeoxyglucose positron emission computed tomography study. Dement Geriatr Cogn Disord. 2013; 35(3-4): 183-196. [CrossRef] [PubMed Abstract]
- Puchades M, Sogn CJ, Maehlen J, Bergersen LH, Gundersen V. Unaltered lactate and glucose transporter levels in the MPTP mouse model of Parkinson’s disease. J Parkinsons Dis. 2013; 3(3): 371-385. [PubMed Abstract]
- Casse R, Rowe CC, Newton M, Berlangieri SU, Scott AM. Positron emission tomography and epilepsy. Mol Imaging Biol. 2002; 4(5): 338-351. [CrossRef] [PubMed Abstract]
- Swartz BE, Brown C, Mandelkern MA, Khonsari A, Patell A, Thomas K, et al. The use of 2-deoxy-2- [18F]fluoro-D-glucose (FDG-PET) positron emission tomography in the routine diagnosis of epilepsy. Mol Imaging Biol. 2002; 4(3): 245-252. [PubMed Abstract]
- Kim YK, Lee DS, Lee SK, Chung CK, Chung JK, Lee MC. (18)F-FDG PET in localization of frontal lobe epilepsy: comparison of visual and SPM analysis. J Nucl Med. 2002; 43(9): 1167-1174. [PubMed Abstract]
- Gok B, Jallo G, Hayeri R, Wahl R, Aygun N. The evaluation of FDG-PET imaging for epileptogenic focus localization in patients with MRI positive and MRI negative temporal lobe epilepsy. Neuroradiology. 2013; 55(5): 541-550. [CrossRef] [PubMed Abstract]
- van’t Klooster MA, Huiskamp G, Zijlmans M, Debets RM, Comans EF, Bouvard S, et al. Can we increase the yield of FDG-PET in the preoperative work-up for epilepsy surgery? Epilepsy Res. 2014; 108(6): 1095- 1105. [PubMed Abstract]
- Rathore C, Dickson JC, Teotónio R, Ell P, Duncan JS. The utility of 18F- fluorodeoxyglucose PET (FDG PET) in epilepsy surgery. Epilepsy Res. 2014; 108(8): 1306-1314. [CrossRef] [PubMed Abstract]
- Baete K, Nuyts J, Van Paesschen W, Suetens P, Dupont P. Anatomical-based FDG-PET reconstruction for the detection of hypo-metabolic regions in epilepsy. IEEE Trans Med Imaging. 2004; 23(4): 510-519. [CrossRef] [PubMed Abstract]
- Willmann O, Wennberg R, May T, Woermann FG, Pohlmann-Eden B. The contribution of 18F-FDG PET in preoperative epilepsy surgery evaluation for patients with temporal lobe epilepsy A meta-analysis. Seizure. 2007; 16(6): 509-520. [PubMed Abstract]
- Lee KK, Salamon N. [18F]fluorodeoxyglucose-positron-emission tomography and MR imaging coregistration for presurgical evaluation of medically refractory epilepsy. AJNR Am J Neuroradiol. 2009; 30(10): 1811-1816. [CrossRef] [PubMed Abstract]
- Kerr WT, Nguyen ST, Cho AY, Lau EP, Silverman DH, Douglas PK, et al. Computer-aided diagnosis and localization of lateralized temporal lobe epilepsy using interictal FDG-PET. Front Neurol. 2013; 4: 31. [CrossRef] [PubMed Abstract]
- Seethalakshmi R, Parkar SR, Nair N, Adarkar SA, Pandit AG, Batra SA, et al. Regional brain metabolism in schizophrenia: An FDG-PET study. Indian J Psychiatry. 2006; 48(3): 149-153. [CrossRef] [PubMed Abstract]
- Buchsbaum MS, Buchsbaum BR, Hazlett EA, Haznedar MM, Newmark R, Tang CY, et al. Relative glucose metabolic rate higher in white matter in patients with schizophrenia. Am J Psychiatry. 2007; 164(7): 1072-1081. [PubMed Abstract]
- Molina V, Gispert JD, Reig S, Sanz J, Pascau J, Santos A, et al. Cerebral metabolism and risperidone treatment in schizophrenia. Schizophr Res. 2003; 60(1): 1-7. [PubMed Abstract]
- Desco M, Gispert JD, Reig S, Sanz J, Pascau J, Sarramea F, et al. Cerebral metabolic patterns in chronic and recent-onset schizophrenia. Psychiatry Res. 2003; 122(2): 125-135. [CrossRef] [PubMed Abstract]
- Fujimoto T, Takeuch K, Matsumoto T, Kamimura K, Hamada R, Nakamura K, et al. Abnormal glucose metabolism in the anterior cingulate cortex in patients with schizophrenia. Psychiatry Res. 2007; 154(1): 49-58. [CrossRef] [PubMed Abstract]
- Buchsbaum MS, Haznedar M, Newmark RE, Chu KW, Dusi N, Entis JJ, et al. FDG-PET and MRI imaging of the effects of sertindole and haloperidol in the prefrontal lobe in schizophrenia. Schizophr Res. 2009; 114 (1-3): 161-171. [PubMed Abstract]
- Parkar SR, Ramanathan S, Nair N, Batra SA, Adarkar SA, Kund P, et al. Are the effects of cannabis dependence on glucose metabolism similar to schizophrenia? An FDG PET understanding. Indian J Psychiatry. 2011; 53(1): 13-20. [CrossRef] [PubMed Abstract]
- Dragogna F, Mauri MC, Marotta G, Armao FT, Brambilla P, Altamura AC. Brain metabolism in substance- induced psychosis and schizophrenia: A preliminary PET study. Neuropsychobiology. 2014; 70(4): 195-202. [CrossRef] [PubMed Abstract]
- Parellada E, Lomena F, Font M, Pareto D, Gutierrez F, Simo M, et al. Fluordeoxyglucose-PET study in first-episode schizophrenic patients during the hallucinatory state, after remission and during linguistic- auditory activation. Nucl Med Commun. 2008; 29(10): 894-900. [CrossRef] [PubMed Abstract]
- Horga G, Fernández-Egea E, Mané A, Font M, Schatz KC, Falcon C, et al. Brain metabolism during hallucination-like auditory stimulation in schizophrenia. PLoS One. 2014; 9(1): e84987. [CrossRef] [PubMed Abstract]
- Altamura AC, Bertoldo A, Marotta G, Paoli RA, Caletti E, Dragogna F, et al. White matter metabolism differentiates schizophrenia and bipolar disorder: a preliminary PET study. Psychiatry Res. 2013; 214(3): 410-414. [CrossRef] [PubMed Abstract]
- McDermott E, de Silva P. Impaired neuronal glucose uptake in pathogenesis of schizophrenia – can GLUT 1 and GLUT 3 deficits explain imaging, post-mortem and pharmacological findings? Med Hypotheses. 2005; 65(6): 1076-1081. [CrossRef] [PubMed Abstract]
- Karussis D. The diagnosis of multiple sclerosis and the various related demyelinating syndromes: a critical review. J Autoimmun. 2014; 48-49: 134-142.[CrossRef] [PubMed Abstract]
- Paulesu E, Perani D, Fazio F, Comi G, Pozzilli C, Martinelli V, et al. Functional basis of memory impairment in multiple sclerosis: a [18F]FDG PET study. Neuroimage. 1996; 4(2): 87-96. [CrossRef] [PubMed Abstract]
- Bakshi R, Miletich RS, Kinkel PR, Emmet ML, Kinkel WR. High-resolution fluorodeoxyglucose positron emission tomography shows both global and regional cerebral hypometabolism in multiple sclerosis. J Neuroimaging. 1998; 8(4): 228-234.[PubMed Abstract]
- Blinkenberg M, Jensen CV, Holm S, Paulson OB, Sørensen PS. A longitudinal study of cerebral glucose metabolism, MRI, and disability in patients with MS. Neurology. 1999; 53(1): 149-153. [CrossRef] [PubMed Abstract]
- Il’ves AG, Prakhova LN, Kataeva GV, Rudas MS, Tomolian NA, Skoromets AA, et al. Changes of cerebral glucose metabolism in patients with multiple sclerosis and their role in formation of the clinical picture and progression of the disease. Zh Nevrol Psikhiatr Im S S Korsakova. 2003; (Spec No 2): 53-60. [PubMed Abstract]
- Derache N, Marié RM, Constans JM, Defer GL. Reduced thalamic and cerebellar rest metabolism in relapsing-remitting multiple sclerosis, a positron emission tomography study: correlations to lesion load. J Neurol Sci. 2006; 245(1-2): 103-109.[CrossRef] [PubMed Abstract]
- Kindred JH, Koo PJ, Rudroff T. Glucose uptake of the spinal cord in patients with multiple sclerosis detected by 18F-fluorodeoxyglucose PET/CT after walking. Spinal Cord. 2014; 52(3): S11-S13. [CrossRef] [PubMed Abstract]
- Rudroff T, Kindred JH, Koo PJ, Karki R, Hebert JR. Asymmetric glucose uptake in leg muscles of patients with Multiple Sclerosis during walking detected by [18F]-FDG PET/CT. NeuroRehabilitation. 2014; 35(4): 813-823. [PubMed Abstract]
- Mathur D, López-Rodas G, Casanova B, Marti MB. Perturbed glucose metabolism: insights into multiple sclerosis pathogenesis. Front Neurol. 2014; 5: 250.[CrossRef] [PubMed Abstract]
- Dong JH, Chen X, Cui M, Yu X, Pang Q, Sun JP. β2-adrenergic receptor and astrocyte glucose metabolism. J Mol Neurosci. 2012; 48(2): 456-463. [PubMed Abstract]
- Sasaki T, Yamaguchi M, Kojima S. Demonstration of hyperaccumulation of [18F]2-fluoro-2- deoxy-D-glucose under oxygen deprivation in living brain slices using bioradiography. Synapse. 2005; 55(4): 252-261. [CrossRef] [PubMed Abstract]
- Martín A, Rojas S, Pareto D, Santalucia T, Millán O, Abasolo I, et al. Depressed glucose consumption at reperfusion following brain ischemia does not correlate with mitochondrial dysfunction and development of infarction: an in vivo positron emission tomography study. Curr Neurovasc Res. 2009; 6(2): 82-88. [CrossRef] [PubMed Abstract]
- Sobrado M, Delgado M, Fernández-Valle E, García-García L, Torres M, Sánchez-Prieto J, et al. Longitudinal studies of ischemic penumbra by using 18F-FDG PET and MRI techniques in permanent and transient focal cerebral ischemia in rats. Neuroimage. 2011; 57(1): 45-54. [CrossRef] [PubMed Abstract]
- Yuan H, Frank JE, Hong Y, An H, Eldeniz C, Nie J, Bunevicius A, et al. Spatiotemporal uptake characteristics of [18]F-2-fluoro-2-deoxy-D-glucose in a rat middle cerebral artery occlusion model. Stroke. 2013; 44(8): 2292-2299. [CrossRef] [PubMed Abstract]
- Bunevicius A, Yuan H, Lin W. The potential roles of 18F-FDG-PET in management of acute stroke patients. Biomed Res Int. 2013; 2013: 634598. [CrossRef] [PubMed Abstract]
- Jiang XF, Zhang T, Sy C, Nie BB, Hu XY, Ding Y. Dynamic metabolic changes after permanent cerebral ischemia in rats with/without post-stroke exercise: a positron emission tomography (PET) study. Neurol Res. 2014; 36(5): 475-482. [CrossRef] [PubMed Abstract]
- Li JH, Lu J, Zhang H. Functional recovery after scutellarin treatment in transient cerebral ischemic rats: A pilot study with (18) F-fluorodeoxyglucose microPET. Evid Based Complement Alternat Med. 2013; 2013: 507091. [PubMed Abstract]
- Wang Z, Song F, Li J, Zhang Y, He Y, Yang J, et al. PET demonstrates functional recovery after treatment by Danhong injection in a rat model of cerebral ischemic-reperfusion injury. Evid Based Complement Alternat Med. 2014; 2014: 430757. [CrossRef] [PubMed Abstract]
- Wang J, Chao F, Han F, Zhang G, Xi Q, Li J, et al. PET demonstrates functional recovery after transplantation of induced pluripotent stem cells in a rat model of cerebral ischemic injury. J Nucl Med. 2013; 54(5): 785-792. [CrossRef] [PubMed Abstract]
- McCall AL, Van Bueren AM, Nipper V, Moholt-Siebert M, Downes H, Lessov N. Forebrain ischemia increases GLUT1 protein in brain microvessels and parenchyma. J Cereb Blood Flow Metab. 1996; 16(1): 69-76. [CrossRef] [PubMed Abstract]
- Vannucci SJ, Seaman LB, Vannucci RC. Effects of hypoxia-ischemia on GLUT1 and GLUT3 glucose transporters in immature rat brain. J Cereb Blood Flow Metab. 1996; 16(1): 77-81. [CrossRef] [PubMed Abstract]
- Vannucci SJ, Reinhart R, Maher F, Bondy CA, Lee WH, Vannucci RC, et al. Alterations in GLUT1 and GLUT3 glucose transporter gene expression following unilateral hypoxia-ischemia in the immature rat brain. Brain Res Dev Brain Res. 1998; 107(2): 255-264. [CrossRef] [PubMed Abstract]
- Zhang WW, Zhang L, Hou WK, Xu YX, Xu H, Lou FC, et al. Dynamic expression of glucose transporters 1 and 3 in the brain of diabetic rats with cerebral ischemia reperfusion. Chin Med J (Engl). 2009; 122(17): 1996-2001. [PubMed Abstract]
- Espinoza-Rojo M, Iturralde-Rodríguez KI, Chánez-Cárdenas ME, Ruiz- Tachiquín ME, Aguilera P. Glucose transporters regulation on ischemic brain: possible role as therapeutic target. Cent Nerv Syst Agents Med Chem. 2010; 10(4): 317-325. [CrossRef] [PubMed Abstract]
- Zhang S, Zuo W, Guo XF, He WB, Chen NH. Cerebral glucose transporter: the possible therapeutic target for ischemic stroke. Neurochem Int. 2014; 70: 22-29.[CrossRef] [PubMed Abstract]
- Nensa F, Beiderwellen K, Heusch P, Wetter A. Clinical applications of PET/MRI: current status and future perspectives. Diagn Interv Radiol. 2014; 20(5): 438-447.[CrossRef] [PubMed Abstract]
- Knuuti J, Schelbert HR, Bax JJ. The need for standardisation of cardiac FDG PET imaging in the evaluation of myocardial viability in patients with chronic ischaemic left ventricular dysfunction. Eur J Nucl Med Mol Imaging. 2002; 29(9): 1257-1266.[CrossRef] [PubMed Abstract]
- Chacko GN. PET imaging in cardiology. Hell J Nucl Med. 2005; 8(3): 140-144.[PubMed Abstract]
- Ghesani M, Depuey EG, Rozanski A. Role of F-18 FDG positron emission tomography (PET) in the assessment of myocardial viability. Echocardiography. 2005; 22(2): 165-177. [CrossRef] [PubMed Abstract]
- Sawada SG. Positron emission tomography for assessment of viability. Curr Opin Cardiol. 2006; 21(5): 464-468. [CrossRef] [PubMed Abstract]
- Health quality Ontario, 2010.
- Anagnostopoulos C, Georgakopoulos A, Pianou N, Nekolla SG. Assessment of myocardial perfusion and viability by positron emission tomography. Int J Cardiol. 2013; 167(5): 1737-1749. [CrossRef] [PubMed Abstract]
- Mielniczuk LM, Birnie D, Ziadi MC, deKemp RA, DaSilva JN, Burwash I, et al. Relation between right ventricular function and increased right ventricular [18F]fluorodeoxyglucose accumulation in patients with heart failure. Circ Cardiovasc Imaging. 2011; 4(1): 59-66. [CrossRef] [PubMed Abstract]
- Can MM, Kaymaz C, Tanboga IH, Tokgoz HC, Canpolat N, Turkyilmaz E, et al. Increased right ventricular glucose metabolism in patients with pulmonary arterial hypertension. Clin Nucl Med. 2011; 36(9): 743-748. [CrossRef] [PubMed Abstract]
- de Keizer B, Scholtens AM, van Kimmenade RR, de Jong PA. High FDG uptake in the right ventricular myocardium of a pulmonary hypertension patient. J Am Coll Cardiol. 2013; 62(18): 1724. [PubMed Abstract]
- Ahmadi A, Ohira H, Mielniczuk LM. FDG PET imaging for identifying pulmonary hypertension and right heart failure. Curr Cardiol Rep. 2015; 17(1): 555. [CrossRef] [PubMed Abstract]
- Dou KF, Yang MF, Yang YJ, Jain D, He ZX. Myocardial 18F-FDG uptake after exercise-induced myocardial ischemia in patients with coronary artery disease. J Nucl Med. 2008; 49(12): 1986-1991. [CrossRef] [PubMed Abstract]
- Ghosh N, Rimoldi OE, Beanlands RS, Camici PG. Assessment of myocardial ischaemia and viability: role of positron emission tomography. Eur Heart J. 2010; 31(24): 2984-2995. [CrossRef] [PubMed Abstract]
- Jain D, He ZX, Lele V, Aronow WS. Direct myocardial ischemia imaging: a new cardiovascular nuclear imaging paradigm. Clin Cardiol. 2014. DOI: 10.1002/clc.22346. [PubMed Abstract]
- Brosius FC 3rd, Liu Y, Nguyen N, Sun D, Bartlett J, Schwaiger M. Persistent myocardial ischemia increases GLUT1 glucose transporter expression in both ischemic and non-ischemic heart regions. J Mol Cell Cardiol. 1997; 29(6): 1675-1685. [CrossRef] [PubMed Abstract]
- Erba PA, Sollini M, Lazzeri E, Mariani G. FDG-PET in cardiac infections. Semin Nucl Med. 2013; 43(5): 377-395. [CrossRef] [PubMed Abstract]
- Bertagna F, Bisleri G, Motta F, Merli G, Cossalter E, Lucchini S, et al. Possible role of F18-FDG- PET/CT in the diagnosis of endocarditis: preliminary evidence from a review of the literature. Int J Cardiovasc Imaging. 2012; 28(6): 1417-1425. [CrossRef] [PubMed Abstract]
- Özcan C, Asmar A, Gill S, Thomassen A, Diederichsen AC. The value of FDG-PET/CT in the diagnostic work-up of extra cardiac infectious manifestations in infectious endocarditis. Int J Cardiovasc Imaging. 2013; 29(7): 1629-1637. [PubMed Abstract]
- Kestler M, Muñoz P, Rodríguez-Créixems M, Rotger A, Jimenez-Requena F, Mari A, et al. Role of 18F-FDG PET in patients with infectious endocarditis. J Nucl Med. 2014; 55(7): 1093-1098. [CrossRef] [PubMed Abstract]
- Bruun NE, Habib G, Thuny F, Sogaard P. Cardiac imaging in infectious endocarditis. Eur Heart J. 2014; 35(10): 624-632. [CrossRef] [PubMed Abstract]
- Asmar A, Ozcan C, Diederichsen AC, Thomassen A, Gill S. Clinical impact of 18F-FDG-PET/CT in the extra cardiac work-up of patients with infective endocarditis. Eur Heart J Cardiovasc Imaging. 2014; 15(9): 1013-1019. [CrossRef] [PubMed Abstract]
- Brinker J. Imaging for infected cardiac implantable electronic devices: a new trick for your pet. J Am Coll Cardiol. 2012; 59(18): 1626-1628. [PubMed Abstract]
- Sarrazin JF, Philippon F, Tessier M, Guimond J, Molin F, Champagne J, et al. Usefulness of fluorine-18 positron emission tomography/computed tomography for identification of cardiovascular implantable electronic device infections. J Am Coll Cardiol. 2012; 59(18): 1616-1625. [CrossRef] [PubMed Abstract]
- Millar BC, Prendergast BD, Alavi A, Moore JE. 18FDG-positron emission tomography (PET) has a role to play in the diagnosis and therapy of infective endocarditis and cardiac device infection. Int J Cardiol. 2013; 167(5): 1724-1736. [CrossRef] [PubMed Abstract]
- Wallner M, Steyer G, Krause R, Gstettner C, von Lewinski D. Fungal endocarditis of a bioprosthetic aortic valve. Pharmacological treatment of a Candida parapsilosis endocarditis. Herz. 2013; 38 (4): 431-434. [CrossRef] [PubMed Abstract]
- Graziosi M, Nanni C, Lorenzini M, Diemberger I, Bonfiglioli R, Pasquale F, et al. Role of 18F-FDG PET/CT in the diagnosis of infective endocarditis in patients with an implanted cardiac device: a prospective study. Eur J Nucl Med Mol Imaging. 2014; 41(8): 1617-1623. [CrossRef] [PubMed Abstract]
- Chen W, Kim J, Molchanova-Cook OP, Dilsizian V. The potential of FDG PET/CT for early diagnosis of cardiac device and prosthetic valve infection before morphologic damages ensue. Curr Cardiol Rep. 2014; 16(3): 459. [CrossRef] [PubMed Abstract]
- Ricciardi A, Sordillo P, Ceccarelli L, Maffongelli G, Calisti G, Di Pietro B, et al. 18-Fluoro-2- deoxyglucose positron emission tomography-computed tomography: an additional tool in the diagnosis of prosthetic valve endocarditis. Int J Infect Dis. 2014; 28: 219-224. [CrossRef] [PubMed Abstract]
- Magnani JW, Dec GW. Myocarditis: current trends in diagnosis and treatment. Circulation. 2006; 113(6): 876-890. [CrossRef] [PubMed Abstract]
- Takano H, Nakagawa K, Ishio N, Daimon M, Daimon M, Kobayashi Y, et al. Active myocarditis in a patient with chronic active Epstein-Barr virus infection. Int J Cardiol. 2008; 130(1): e11-e13. [CrossRef] [PubMed Abstract]
- von Olshausen G, Hyafil F, Langwieser N, Laugwitz KL, Schwaiger M, Ibrahim T. Detection of acute inflammatory myocarditis in Epstein Barr virus infection using hybrid 18F-fluoro-deoxyglucose-positron emission tomography/magnetic resonance imaging. Circulation. 2014; 130(11): 925-926. [CrossRef] [PubMed Abstract]
- Strobel K, Schuler R, Genoni M. Visualization of pericarditis with fluoro-deoxy-glucose-positron emission tomography/computed tomography. Eur Heart J. 2008; 29(9): 1212. [CrossRef] [PubMed Abstract]
- Salomäki SP, Hohenthal U, Kemppainen J, Pirilä L, Saraste A. Visualization of pericarditis by fluorodeoxyglucose PET. Eur Heart J Cardiovasc Imaging. 2014; 15(3): 291. [CrossRef] [PubMed Abstract]
- Blockmans D, Stroobants S, Vanderschueren S, Peetermans W, Bobbaers H, Mortelmans L. FDG-PET scan in the diagnosis of postmeningococcal pericarditis. Clin Nucl Med. 2002; 27(1): 59. [CrossRef] [PubMed Abstract]
- Losik SB, Studentsova Y, Margouleff D. Chemotherapy-induced pericarditis on F-18 FDG positron emission tomography scan. Clin Nucl Med. 2003; 28(11): 913-915.[CrossRef] [PubMed Abstract]
- Yiu KH, Leung YL, Siu CW, Jim MH, Chow WH, Tse HF. Focal pericarditis in a huge heart demonstrated by positron emission tomography/computed tomography. Clin Nucl Med. 2009; 34(6): 362-364. [CrossRef] [PubMed Abstract]
- Ha JW, Lee JD, Ko YG, Yun M, Rim SJ, Chung N, et al. Images in cardiovascular medicine. Assessment of pericardial inflammation in a patient with tuberculous effusive constrictive pericarditis with 18F-2- deoxyglucose positron emission tomography. Circulation. 2006; 113(1): e4-e5. [PubMed Abstract]
- Testempassi E, Kubota K, Morooka M, Ito K, Masuda-Miyata Y, Yamashita H, et al. Constrictive tuberculous pericarditis diagnosed using 18F-fluorodeoxyglucose positron emission tomography: a report of two cases. Ann Nucl Med. 2010; 24(5): 421-425. [PubMed Abstract]
- Lee VY, Wong JT, Fan HC, Yeung VT. Tuberculous pericarditis presenting as massive haemorrhagic pericardial effusion. BMJ Case Rep. 2012; 2012: pii bcr0320125967. [CrossRef]
- Dong A, Dong H, Wang Y, Cheng C, Zuo C, Lu J. (18)F-FDG PET/CT in differentiating acute tuberculous from idiopathic pericarditis: preliminary study. Clin Nucl Med. 2013; 38(4): e160-e165. [PubMed Abstract]
- Ozmen O, Koksal D, Ozcan A, Tatci E, Gokcek A. Decreased metabolic uptake in tuberculous pericarditis indicating response to antituberculosis therapy on FDG PET/CT. Clin Nucl Med. 2014; 39(10): 917-919. [CrossRef] [PubMed Abstract]
- Couturier B, Huyge V, Soyfoo MS. Pericarditis revealing large vessel vasculitis. ISRN Rheumatol. 2011; 2011: 648703. [CrossRef] [PubMed Abstract]
- Zerizer I, Tan K, Khan S, Barwick T, Marzola MC, Rubello D, et al. Role of FDG-PET and PET/CT in the diagnosis and management of vasculitis. Eur J Radiol. 2010; 73(3): 504-509. [CrossRef] [PubMed Abstract]
- Treglia G, Mattoli MV, Leccisotti L, Ferraccioli G, Giordano A. Usefulness of whole-body fluorine-18- fluorodeoxyglucose positron emission tomography in patients with large-vessel vasculitis: a systematic review. Clin Rheumatol. 2011; 30(10): 1265-1275. [CrossRef] [PubMed Abstract]
- Balink H, Bennink RJ, van Eck-Smit BL, Verberne HJ. The role of 18F-FDG PET/CT in large- vessel vasculitis: appropriateness of current classification criteria? Biomed Res Int. 2014; 2014: 687608. [PubMed Abstract]
- Karunanithi S, Sharma P, Bal C, Kumar R. (18)F-FDG PET/CT for diagnosis and treatment response evaluation in large vessel vasculitis. Eur J Nucl Med Mol Imaging. 2014; 41(3): 586-587. [PubMed Abstract]
- Blockmans D. PET in vasculitis. Ann N Y Acad Sci. 2011; 1228: 64-70.[CrossRef] [PubMed Abstract]
- Puppo C, Massollo M, Paparo F, Camellino D, Piccardo A, Shoushtari Zadeh Naseri M, et al. Giant cell arteritis: a systematic review of the qualitative and semiquantitative methods to assess vasculitis with 18F-fluorodeoxyglucose positron emission tomography. Biomed Res Int. 2014; 2014: 574248. [CrossRef] [PubMed Abstract]
- Wen D, Du X, Ma CS. Takayasu arteritis: diagnosis, treatment and prognosis. Int Rev Immunol. 2012; 31(6): 462-473. [CrossRef] [PubMed Abstract]
- Tezuka D, Haraguchi G, Ishihara T, Ohigashi H, Inagaki H, Suzuki J, et al. Role of FDG PET-CT in Takayasu arteritis: sensitive detection of recurrences. JACC Cardiovasc Imaging. 2012; 5(4): 422-429. [PubMed Abstract]
- Isobe M. Takayasu arteritis revisited: current diagnosis and treatment. Int J Cardiol. 2013; 168(1): 3-10. [CrossRef] [PubMed Abstract]
- Karapolat I, Kalfa M, Keser G, Yalçin M, Inal V, Kumanlioğlu K, et al. Comparison of F18-FDG PET/CT findings with current clinical disease status in patients with Takayasu’s arteritis. Clin Exp Rheumatol. 2013; 31(1): S15-S21. [PubMed Abstract]
- Doughan AR, Williams BR. Cardiac sarcoidosis. Heart. 2006; 92(2): 282-288.[CrossRef] [PubMed Abstract]
- Sekhri V, Sanal S, DeLorenzo LJ, Aronow WS, Maguire GP. Cardiac sarcoidosis: a comprehensive review. Arch Med Sci. 2011; 7(4): 546-554. [CrossRef] [PubMed Abstract]
- Skali H, Schulman AR, Dorbala S. 18F-FDG PET/CT for the assessment of myocardial sarcoidosis. Curr Cardiol Rep. 2013; 15(4): 352. [CrossRef] [PubMed Abstract]
- Schatka I, Bengel FM. Advanced imaging of cardiac sarcoidosis. J Nucl Med. 2014; 55(1): 99- 106. [CrossRef] [PubMed Abstract]
- Tahara N, Tahara A, Nitta Y, Kodama N, Mizoguchi M, Kaida H, et al. Heterogeneous myocardial FDG uptake and the disease activity in cardiac sarcoidosis. JACC Cardiovasc Imaging. 2010; 3(12): 1219-1228. [CrossRef] [PubMed Abstract]
- Ohira H, Tsujino I, Yoshinaga K. 18F-Fluoro-2-deoxyglucose positron emission tomography in cardiac sarcoidosis. Eur J Nucl Med Mol Imaging. 2011; 38(9): 1773-1783. [CrossRef] [PubMed Abstract]
- Keijsers RG, van den Heuvel DA, Grutters JC. Imaging the inflammatory activity of sarcoidosis. Eur Respir J. 2013; 41(3): 743-751. [CrossRef] [PubMed Abstract]
- Sobic-Saranovic D, Artiko V, Obradovic V. FDG PET imaging in sarcoidosis. Semin Nucl Med. 2013; 43(6): 404-411. [PubMed Abstract]
- Mc Ardle BA, Leung E, Ohira H, Cocker MS, deKemp RA, DaSilva J, et al. The role of F(18)- fluorodeoxyglucose positron emission tomography in guiding diagnosis and management in patients with known or suspected cardiac sarcoidosis. J Nucl Cardiol. 2013; 20(2): 297-306. [PubMed Abstract]
- Paz YE, Bokhari S. The role of F18-fluorodeoxyglucose positron emission tomography in identifying patients at high risk for lethal arrhythmias from cardiac sarcoidosis and the use of serial scanning to guide therapy. Int J Cardiovasc Imaging. 2014; 30(2): 431-438. [PubMed Abstract]
- Orii M, Imanishi T, Akasaka T. Assessment of cardiac sarcoidosis with advanced imaging modalities. Biomed Res Int. 2014; 2014: 897956. [CrossRef] [PubMed Abstract]
- Kaneta T, Hakamatsuka T, Takanami K, Yamada T, Takase K, Sato A, et al. Evaluation of the relationship between physiological FDG uptake in the heart and age, blood glucose level, fasting period, and hospitalization. Ann Nucl Med. 2006; 20(3): 203-208.[CrossRef] [PubMed Abstract]
- Morooka M, Moroi M1, Uno K, Ito K, Wu J, Nakagawa T, et al. Cardiac sarcoidosis. EJNMMI Res. 2014; 4(1): 1. [CrossRef] [PubMed Abstract]
- Yoshinaga K, Tamaki N. Imaging myocardial metabolism. Current Opin Biotechnol. 2007; 18(1): 52-59. [CrossRef] [PubMed Abstract]
- Ogawa M, Magata Y, Kato T, Hatano K, Ishino S, Mukai T, et al. Application of 18F-FDG PET for monitoring the therapeutic effect of antiinflammatory drugs on stabilization of vulnerable atherosclerotic plaques. J Nucl Med. 2006; 47(11): 1845-1850. [PubMed Abstract]
- Chen W, Dilsizian V. (18)F-fluorodeoxyglucose PET imaging of coronary atherosclerosis and plaque inflammation. Curr Cardiol Rep. 2010; 12(2): 179-184. [PubMed Abstract]
- Stolzmann P, Subramanian S, Abdelbaky A, Maurovich-Horvat P, Scheffel H, Tawakol A, et al. Complementary value of cardiac FDG PET and CT for the characterization of atherosclerotic disease. Radiographics. 2011; 31(5): 1255-1269. [CrossRef] [PubMed Abstract]
- Marzola MC, Saboury B, Chondrogiannis S, Rampin L, Grassetto G, Ferretti A, et al. Role of FDG PET/CT in investigating the mechanisms underlying atherosclerotic plaque formation and evolution. Rev Esp Med Nucl Imagen Mol. 2013; 32(4): 246-252.[CrossRef] [PubMed Abstract]
- Tavakoli S, Vashist A, Sadeghi MM. Molecular imaging of plaque vulnerability. J Nucl Cardiol. 2014; 21(6): 1112-1128. [CrossRef] [PubMed Abstract]
- Tarkin JM, Joshi FR, Rudd JH. PET imaging of inflammation in atherosclerosis. Nat Rev Cardiol. 2014; 11(8): 443-457. [CrossRef] [PubMed Abstract]
- Blomberg BA, Høilund-Carlsen PF. [18F]-Fluorodeoxyglucose PET imaging of atherosclerosis. PET Clin. 2015; 10(1): 1-7. [CrossRef] [PubMed Abstract]
- Truijman MT, Kwee RM, van Hoof RH, Hermeling E, van Oostenbrugge RJ, Mess WH, et al. Combined 18F-FDG PET-CT and DCE-MRI to assess inflammation and microvascularization in atherosclerotic plaques. Stroke. 2013; 44(12): 3568-3570. [CrossRef] [PubMed Abstract]
- Sheikine Y, Akram K. FDG-PET imaging of atherosclerosis: Do we know what we see? Atherosclerosis. 2010; 211(2): 371-380. [CrossRef] [PubMed Abstract]
- Buettner C, Rudd JH, Fayad ZA. Determinants of FDG uptake in atherosclerosis. JACC Cardiovasc Imaging. 2011; 4(12): 1302-1304. [CrossRef] [PubMed Abstract]
- Ogawa M, Nakamura S, Saito Y, Kosugi M, Magata Y. What can be seen by 18F-FDG PET in atherosclerosis imaging? The effect of foam cell formation on 18F-FDG uptake to macrophages in vitro. J Nucl Med. 2012; 53(1): 55-58. [CrossRef] [PubMed Abstract]
- Folco EJ, Sheikine Y, Rocha VZ, Christen T, Shvartz E, Sukhova GK, et al. Hypoxia but not inflammation augments glucose uptake in human macrophages: Implications for imaging atherosclerosis with 18F-fluorine-labeled 2- deoxy-D-glucose positron emission tomography. J Am Coll Cardiol. 2011; 58(6): 603-614. [PubMed Abstract]
- Lee SJ, Thien Quach CH, Jung KH, Paik JY, Lee JH, Park JW, et al. Oxidized low-density lipoprotein stimulates macrophage 18F-FDG uptake via hypoxia-inducible factor-1α activation through Nox2- dependent reactive oxygen species generation. J Nucl Med. 2014; 55(10): 1699-1705. [PubMed Abstract]
- Dweck MR, Chow MW, Joshi NV, Williams MC, Jones C, Fletcher AM, et al. Coronary arterial 18F-sodium fluoride uptake: a novel marker of plaque biology. J Am Coll Cardiol. 2012; 59(17): 1539-1548. [PubMed Abstract]
- Derlin T, Tóth Z, Papp L, Wisotzki C, Apostolova I, Habermann CR, et al. Correlation of inflammation assessed by 18F-FDG PET, active mineral deposition assessed by 18F-fluoride PET, and vascular calcification in atherosclerotic plaque: a dual-tracer PET/CT study. J Nucl Med. 2011; 52(7): 1020-1027. [CrossRef] [PubMed Abstract]
- Conway RG, Chernet E, De Rosa DC, Benschop RJ, Need AB, Collins EC, et al. Glucose metabolic trapping in mouse arteries: nonradioactive assay of atherosclerotic plaque inflammation applicable to drug discovery. PLoS One. 2012; 7(11): e50349. [CrossRef]
- Tahara N, Mukherjee J, de Haas HJ, Petrov AD, Tawakol A, Haider N, et al. 2-deoxy-2- [18F]fluoro-D-mannose positron emission tomography imaging in atherosclerosis. Nat Med. 2014; 20(2): 215-219. [CrossRef] [PubMed Abstract]
- Zaman RT, Kosuge H, Pratx G, Carpenter C, Xing L, McConnell MV. Fiber-optic system for dual-modality imaging of glucose probes 18F-FDG and 6-NBDG in atherosclerotic plaques. PLoS One. 2014; 9(9): e108108. [CrossRef] [PubMed Abstract]
- Ozguven MA, Karacalioglu AO, Ince S, Emer MO. Altered biodistribution of FDG in patients with type-2 diabetes mellitus. Ann Nucl Med. 2014; 28(6): 505-511. [PubMed Abstract]
- Bucerius J, Mani V, Moncrieff C, Rudd JH, Machac J, Fuster V, et al. Impact of noninsulin-dependent type 2 diabetes on carotid wall 18F-fluorodeoxyglucose positron emission tomography uptake. J Am Coll Cardiol. 2012; 59(23): 2080-2088.[CrossRef] [PubMed Abstract]
- Kim TN, Kim S, Yang SJ, Yoo HJ, Seo JA, Kim SG, et al. Vascular inflammation in patients with impaired glucose tolerance and type 2 diabetes: analysis with 18F-fluorodeoxyglucose positron emission tomography. Circ Cardiovasc Imaging. 2010; 3(2): 142-148. [CrossRef] [PubMed Abstract]
- Goodpaster BH, Bertoldo A, Ng JM, Azuma K, Pencek RR, Kelley C, et al. Interactions among glucose delivery, transport, and phosphorylation that underlie skeletal muscle insulin resistance in obesity and type 2 Diabetes: studies with dynamic PET imaging. Diabetes. 2014; 63(3): 1058-1068. [CrossRef] [PubMed Abstract]
- Morbelli S, Marini C, Adami GF, Kudomi N, Camerini G, Iozzo P, et al. Tissue specificity in fasting glucose utilization in slightly obese diabetic patients submitted to bariatric surgery. Obesity (Silver Spring). 2013; 21(3): E175-E181. [CrossRef] [PubMed Abstract]
- Kawasaki K, Ishii K, Saito Y, Oda K, Kimura Y, Ishiwata K. Influence of mild hyperglycemia on cerebral FDG distribution patterns calculated by statistical parametric mapping. Ann Nucl Med. 2008; 22(3): 191- 200. [CrossRef] [PubMed Abstract]
- Baker LD, Cross DJ, Minoshima S, Belongia D, Watson GS, Craft S. Insulin resistance and Alzheimer-like reductions in regional cerebral glucose metabolism for cognitively normal adults with prediabetes or early type 2 diabetes. Arch Neurol. 2011; 68(1): 51-57. [CrossRef] [PubMed Abstract]
- Keidar Z, Militianu D, Melamed E, Bar-Shalom R, Israel O. The diabetic foot: initial experience with 18F-FDG PET/CT. J Nucl Med. 2005; 46(3): 444-449. [PubMed Abstract]
- Büsing KA, Schönberg SO, Brade J, Wasser K. Impact of blood glucose, diabetes, insulin, and obesity on standardized uptake values in tumors and healthy organs on 18F-FDG PET/CT. Nucl Med Biol. 2013; 40(2): 206-213. [CrossRef] [PubMed Abstract]
- Rabkin Z, Israel O, Keidar Z. Do hyperglycemia and diabetes affect the incidence of false-negative 18F-FDG PET/CT studies in patients evaluated for infection or inflammation and cancer? A Comparative analysis. J Nucl Med. 2010; 51(7): 1015-1020. [CrossRef] [PubMed Abstract]
- Haley M, Konski A, Li T, Cheng JD, Maurer A, Haluszka O, et al. Influence of diabetes on the interpretation of PET scans in patients with esophageal cancer. Gastrointest Cancer Res. 2009; 3(4): 149 -152. [PubMed Abstract]
- Hara T, Higashi T, Nakamoto Y, Suga T, Saga T, Ishimori T, et al. Significance of chronic marked hyperglycemia on FDG-PET: is it really problematic for clinical oncologic imaging? Ann Nucl Med. 2009; 23(7): 657-669. [CrossRef] [PubMed Abstract]
- Chang YC, Yen TC, Ng KK, See LC, Lai CH, Chang TC, et al. Does diabetes mellitus influence the efficacy of FDG-PET in the diagnosis of cervical cancer? Eur J Nucl Med Mol Imaging. 2005; 32(6): 647- 652. [CrossRef] [PubMed Abstract]
- Niccoli-Asabella A, Iuele FI, Merenda N, Pisani AR, Notaristefano A, Rubini G. 18F- FDGPET/CT: diabetes and hyperglycaemia. Nucl Med Rev Cent East Eur. 2013; 16(2): 57-61. [PubMed Abstract]
- Martin J, Saleem N. 18F-FDG PET-CT scanning and diabetic patients: what to do? Nucl Med Commun. 2014; 35(12): 1197-1203. [CrossRef] [PubMed Abstract]
- Song HS, Yoon JK, Lee SJ, Yoon SH, Jo KS, An YS. Ultrashort-acting insulin may improve on 18F-FDG PET/CT image quality in patients with uncontrolled diabetic mellitus. Nucl Med Commun. 2013; 34(6): 527-532. [CrossRef] [PubMed Abstract]
- Gontier E, Fourme E, Wartski M, Blondet C, Bonardel G, Le Stanc E, et al. High and typical 18F-FDG bowel uptake in patients treated with metformin. Eur J Nucl Med Mol Imaging. 2008; 35 (1): 95-99. [CrossRef] [PubMed Abstract]
- Bybel B, Greenberg ID, Paterson J, Ducharme J, Leslie WD. Increased F-18 FDG intestinal uptake in diabetic patients on metformin: a matched case-control analysis. Clin Nucl Med. 2011; 36(6): 452-456. [CrossRef] [PubMed Abstract]
- Oh JR, Song HC, Chong A, Ha JM, Jeong SY, Min JJ, et al. Impact of medication discontinuation on increased intestinal FDG accumulation in diabetic patients treated with metformin. AJR Am J Roentgenol. 2010; 195(6): 1404-1410. [CrossRef] [PubMed Abstract]
- Ozülker T, Ozülker F, Mert M, Ozpaçaci T. Clearance of the high intestinal (18)F-FDG uptake associated with metformin after stopping the drug. Eur J Nucl Med Mol Imaging. 2010; 37(5): 1011- 1017. [PubMed Abstract]
- Mashhedi H, Blouin MJ, Zakikhani M, David S, Zhao Y, Bazile M, et al. Metformin abolishes increased tumor (18)F-2-fluoro-2-deoxy-D-glucose uptake associated with a high energy diet. Cell Cycle. 2011; 10(16): 2770-2778. [PubMed Abstract]
- Habibollahi P, van den Berg NS, Kuruppu D, Loda M, Mahmood U. Metformin – an adjunct antineoplastic therapy – divergently modulates tumor metabolism and proliferation, interfering with early response prediction by 18F-FDG PET imaging. J Nucl Med. 2013; 54(2): 252-258. [CrossRef] [PubMed Abstract]
- Huang YC, Hsu CC, Lin WC, Yin TK, Huang CW, Wang PW, et al. Effects of metformin on the cerebral metabolic changes in type 2 diabetic patients. ScientificWorldJournal. 2014; 2014: 694326. [CrossRef] [PubMed Abstract]
- Himms-Hagen J. Brown adipose tissue thermogenesis: interdisciplinary studies. FASEB J. 1990; 4(11): 2890-2898. [PubMed Abstract]
- Cannon B, Nedergaard J. Brown adipose tissue: function and physiological significance. Physiol Rev. 2004; 84(1): 277-359. [CrossRef] [PubMed Abstract]
- Bauwens M, Wierts R, van Royen B, Bucerius J, Backes W, Mottaghy F, et al. Molecular imaging of brown adipose tissue in health and disease. Eur J Nucl Med Mol Imaging. 2014; 41(4): 776-791. [CrossRef] [PubMed Abstract]
- Ouellet V, Routhier-Labadie A, Bellemare W, Lakhal-Chaieb L, Turcotte E, Carpentier AC, et al. Outdoor temperature, age, sex, body mass index, and diabetic status determine the prevalence, mass, and glucose-uptake activity of 18F-FDG-detected BAT in humans. J Clin Endocrinol Metab. 2011; 96(1): 192-199. [PubMed Abstract]
- Nedergaard J, Bengtsson T, Cannon B. Three years with adult human brown adipose tissue. Ann N Y Acad Sci. 2010; 1212: E20-E36. [CrossRef] [PubMed Abstract]
- Jacene HA, Cohade CC, Zhang Z, Wahl RL. The relationship between patients’ serum glucose levels and metabolically active brown adipose tissue detected by PET/CT. Mol Imaging Biol. 2011; 13(6): 1278- 1283. [CrossRef] [PubMed Abstract]
- Hanssen MJ, Wierts R, Hoeks J, Gemmink A, Brans B, Mottaghy FM, et al. Glucose uptake in human brown adipose tissue is impaired upon fasting-induced insulin resistance. Diabetologia. 2014. [CrossRef]
- Wu C, Cheng W, Sun Y, Dang Y, Gong F, Zhu H, et al. Activating brown adipose tissue for weight loss and lowering of blood glucose levels: A microPET study using obese and diabetic model mice. PLoS One. 2014; 9(12): e113742. [CrossRef] [PubMed Abstract]
- Cypess AM, Weiner LS, Roberts-Toler C, Elía EF, Kessler SH, Kahn PA, et al. Activation of human brown adipose tissue by a β3-adrenergic receptor agonist. Cell Metab. 2015; 21(1): 33-38. [PubMed Abstract]
- Olsen JM, Sato M, Dallner OS, Sandström AL, Pisani DF, Chambard JC, et al. Glucose uptake in brown fat cells is dependent on mTOR complex 2-promoted GLUT1 translocation. J Cell Biol. 2014; 207(3): 365-374. [CrossRef] [PubMed Abstract]
- Stefanidis I, Kytoudis K, Papathanasiou AA, Zaragotas D, Melistas L, Kitsios GD, et al. XbaI GLUT1 gene polymorphism and the risk of type 2 diabetes with nephropathy. Dis Markers. 2009; 27(1): 29-35. [CrossRef] [PubMed Abstract]
- Schaan BD, Irigoyen MC, Bertoluci MC, Lima NG, Passaglia J, Hermes E, et al. Increased urinary TGF- beta1 and cortical renal GLUT1 and GLUT2 levels: additive effects of hypertension and diabetes. Nephron Physiol. 2005; 100(3): 43-50.[PubMed Abstract]
- Linden KC, DeHaan CL, Zhang Y, Glowacka S, Cox AJ, Kelly DJ, et al. Renal expression and localization of the facilitative glucose transporters GLUT1 and GLUT12 in animal models of hypertension and diabetic nephropathy. Am J Physiol Renal Physiol. 2006; 290(1): F205-F213. [CrossRef] [PubMed Abstract]
- Hodgkinson AD, Page T, Millward BA, Demaine AG. A novel polymorphism in the 5′ flanking region of the glucose transporter (GLUT1) gene is strongly associated with diabetic nephropathy in patients with Type 1 diabetes mellitus. J Diabetes Complications. 2005; 19(2): 65-69. [CrossRef] [PubMed Abstract]
- Hodgkinson AD, Millward BA, Demaine AG. Polymorphisms of the glucose transporter (GLUT1) gene are associated with diabetic nephropathy. Kidney Int. 2001; 59(3): 985-989. [CrossRef] [PubMed Abstract]
- Cui W, Du B, Zhou W, Jia Y, Sun G, Sun J, et al. Relationship between five GLUT1 gene single nucleotide polymorphisms and diabetic nephropathy: a systematic review and meta-analysis. Mol Biol Rep. 2012; 39(8): 8551-8558. [CrossRef] [PubMed Abstract]
- Ciaraldi TP, Mudaliar S, Barzin A, Macievic JA, Edelman SV, Park KS, et al. Skeletal muscle GLUT1 transporter protein expression and basal leg glucose uptake are reduced in type 2 diabetes. J Clin Endocrinol Metab. 2005; 90(1): 352-358. [CrossRef] [PubMed Abstract]
- Sokolovska J, Isajevs S, Sugoka O, Sharipova J, Lauberte L, Svirina D, et al. Correction of glycaemia and GLUT1 level by mildronate in rat streptozotocin diabetes mellitus model. Cell Biochem Funct. 2011; 29(1): 55-63. [CrossRef] [PubMed Abstract]
- Porter-Turner MM, Skidmore JC, Khokher MA, Singh BM, Rea CA. Relationship between erythrocyte GLUT1 function and membrane glycation in type 2 diabetes. Br J Biomed Sci. 2011; 68(4): 203-207. [PubMed Abstract]
- Garg M, Thamotharan M, Becker DJ, Devaskar SU. Adolescents with clinical type 1 diabetes display reduced red blood cell glucose transporter isoform 1 (GLUT1). We speculate that this may contribute to the perturbed cognition seen in T1D adolescents. Pediatr Diabetes. 2014; 15(7): 511-518. [PubMed Abstract]
- Lu L, Seidel CP, Iwase T, Stevens RK, Gong YY, Wang X, et al. Suppression of GLUT1; a new strategy to prevent diabetic complications. J Cell Physiol. 2013; 228(2): 251-257. [CrossRef] [PubMed Abstract]
Suggested reading
The physiological FDG uptake of the myocardium can hamper the detection of myocarditis and atherosclerotic lesions of coronaries. Please refer to Gaeta C, Fernández Y, Pavía J, Flotats A, Artigas C, Deportos J, et al. Reduced myocardial 18F-FDG uptake after calcium channel blocker administration. Initial observation for a potential new method to improve plaque detection. Eur J Nucl Med Mol Imaging. 2011; 38(11): 2018-2024. [CrossRef] [PubMed Abstract]
The role of PET imaging with 18F-FDG in cancers has been described in this article, but some non-malignant lesions also show enhanced 18F-FDG uptake. For a general overview of 18F-FDG uptake into benign non-physiologic lesions please refer to Metser U, Even-Sapir E. Increased (18)F-fluorodeoxyglucose uptake in benign, nonphysiologic lesions found on whole-body positron emission tomography/computed tomography (PET/CT): accumulated data from four years of experience with PET/CT. Semin Nucl Med. 2007; 37(3): 206-222. [PubMed Abstract]
Thyroid lesions with enhanced 18F-FDG uptake can be incidentally identified during 18F-FDG PET investigations of non-thyroid disorders, which are often due to benign adenomatoid nodules. It is obviously important that such lesions are confirmed as benign or malignant. Interestingly, GLUT1 expression is not detected in benign nodules or in normal thyroid tissue, whilst it is frequently detected in thyroid cancers. GLUT1 expression is therefore a potential clinical marker for distinguishing benign and malignant thyroid lesions.
For further reading please see the references given below.
- Haber RS, Weiser KR, Pritsker A, Reder I, Burstein DE. GLUT1 glucose transporter expression in benign and malignant thyroid nodules. Thyroid. 1997; 7(3): 363-367. [CrossRef] [PubMed Abstract]
- Chen W, Parsons M, Torigian DA, Zhuang H, Alavi A. Evaluation of thyroid FDG uptake incidentally identified on FDG-PET/CT imaging. Nucl Med Commun. 2009; 30(3): 240-244. [CrossRef] [PubMed Abstract]
- Ho TY, Liou MJ, Lin KJ, Yen TC. Prevalence and significance of thyroid uptake detected by 18F-FDG PET. Endocrine. 2011; 40(2): 297-302. [CrossRef] [PubMed Abstract]
- Bertagna F, Treglia G, Piccardo A, Giubbini R. Diagnostic and clinical significance of F-18-FDG-PET/CT thyroid incidentalomas. J Clin Endocrinol Metab. 2012; 97(11): 3866-3875. [CrossRef] [PubMed Abstract]
- Soelberg KK, Bonnema SJ, Brix TH, Hegedüs L. Risk of malignancy in thyroid incidentalomas detected by 18F-fluorodeoxyglucose positron emission tomography: a systematic review. Thyroid. 2012; 22(9): 918-925. [PubMed Abstract]
- Lee S, Park T, Park S, Pahk K, Rhee S, Cho J, et al. The clinical role of dual-time-point (18)F-FDG PET/CT in differential diagnosis of the thyroid incidentaloma. Nucl Med Mol Imaging. 2014; 48(2): 121-129. [PubMed Abstract]
- Flukes S, Lenzo N, Moschilla G, Sader C. Positron emission tomography-positive thyroid nodules: rate of malignancy and histological features. ANZ J Surg. 2014. [Epub ahead of print] [CrossRef] [PubMed Abstract]
Breast fibroadenomas are non-cancerous tumours composed of breast gland tissue and tissue that supports the breast gland tissue and these can show enhanced 18F-FDG uptake. It is obviously important to distinguish such fibroadenomas from breast cancer. GLUT1 expression is generally not detected in breast fibroadenomas and is therefore a useful marker to distinguish fibroademas from malignant tumours.
For further reading please see the references given below.
- Yamaguchi R, Futamata Y, Yoshimura F, Murakami N, Koufuji K, Kutami R, et al. Mastopathic-type fibroadenoma and ductal adenoma of the breast with false-positive fluorodeoxyglucose positron emission tomography. Jpn J Radiol. 2009; 27(7): 280-284. [CrossRef] [PubMed Abstract]
- Hao LS, Ni Q, Jia GQ, Wang G, Qian K, Liu YJ, et al. Expression of glucose transporter 1 in human breast carcinoma and its clinical significance. Sichuan Da Xue Xue Bao Yi Xue Ban. 2009; 40(1): 44-47. [PubMed Abstract]
- Makis W, Ciarallo A, Hickeson M, Derbekyan V. Rapidly growing complex fibroadenoma with surrounding ductal hyperplasia mimics breast malignancy on serial F-18 FDG PET/CT imaging. Clin Nucl Med. 2011; 36(7): 576-579. [CrossRef] [PubMed Abstract]
- Adejolu M, Huo L, Rohren E, Santiago L, Yang WT. False-positive lesions mimicking breast cancer on FDG PET and PET/CT. AJR Am J Roentgenol. 2012; 198(3): W304-W314. [CrossRef] [PubMed Abstract]
- Clement DS, van Diest PJ, Fernandez MA, Huijbregts JE, de Jong PA. Fibroadenoma of the breast with positive pet-scan. JBR-BTR. 2012; 95(3): 132-133. [PubMed Abstract]
- Bertagna F, Evangelista L, Piccardo A, Bertoli M, Bosio G, Giubbini R, et al. Multicentric study on (18)F-FDG-PET/CT breast incidental uptake in patients studied for non-breast malignant purposes. Rev Esp Med Nucl Imagen Mol. 2015; 34(1): 24-29. [PubMed Abstract]
Article information
Corresponding author: Simon G. Patching.
Copyright: © 2015 Patching SG.
How to cite: Patching SG. Roles of facilitative glucose transporter GLUT1 in [18F]FDG positron emission tomography (PET) imaging of human diseases. J. Diagn. Imaging Ther. 2015; 2(1): 30-102 (https://dx.doi.org/10.17229/jdit.2015-0301-014).
Article history: Received 09 February 2015; Revised 26 February 2015; Accepted 27 February 2015; Published online 01 March 2015.
Archive link: JDIT-2015-0301-014
home »