RESEARCH ARTICLE
Ornella Ferrandoa*, Tindaro Scolarob, Andrea Ciarmielloc, Franca Foppianoa
aMedical Physics Department
bRadiotherapy Department
cNuclear Medicine Department, S. Andrea Hospital, La Spezia, Italy
Abstract
In previous years FDG-PET/CT has acquired a significant role in radiotherapy treatment of head and neck (H&N) disease. Materials and Methods. Thirty patients with H&N cancer who underwent FDG-PET/CT examination were analysed retrospectively. Gross tumour volumes were first delineated on CT (CT-GTVs) blinded to PET data and successively on the co-registered PET/CT (PET-GTVs). Both volumes were visible on the fused images. CT and PET/CT volumes were compared. The aim was to understand if tumour regions might be omitted if PET data is not considered in the planning stage. A simulation of a treatment plan was developed based on the CT-GTVs and the dosimetric coverage of PET-highlighted tumour regions were evaluated. Results. The mismatching fraction between PET and CT volumes (56%) indicates that PET significantly changes the GTV definition. A simulation of a CT-based treatment plan resulted in 23% of the analysed patients having important underdosages in PET volumes (primary tumour) in the range (-96.5% to -27.4%) while the lymph nodes were underdosaged in the range (-99.1% to -25.1%) for 33% of patients. Conclusions. In radiotherapy treatment of H&N disease, PET/CT provides a better target definition and prevents exclusion of pathologic regions. In the population that we analysed here, PET data integrating other conventional diagnostic modalities such as CE-CT, MRI or US avoids significant underdosages of the tumour tissue in 37% of patients.
Keywords: contouring; dosimetry; head and neck; PET/CT; radiotherapy
1. Introduction
In head and neck (H&N) tumours, computed tomography (CT) and magnetic resonance imaging (MRI) are used for standard examinations, for staging and for follow up. Both modalities provide anatomic information about the tumour and metastases [1,2].
In previous years FDG-PET/CT has proved to be more accurate than conventional staging [3,4,5]. Moreover, in radiotherapy treatment planning, FDG-PET/CT has become an important tool in terms of target volume delineation [6,7]. The added value of FDG-PET/CT in H&N disease was demonstrated by identification of the occult primary tumour in patients with cervical node metastasis and the detection of distant metastases [8,9,10]. As demonstrated in many studies, the use of PET imaging in radiotherapy treatment planning changes delineation of the target volumes with respect to conventional anatomical imaging [11–17].
Consequently, the use of PET imaging in radiotherapy treatment might change the dosimetric tumour coverage with respect to a conventional CT-based treatment plan. How different the dosimetric tumour coverage in a PET/CT-based treatment plan is compared to a CT-based treatment plan is the overall question that we attempted to answer in this study as applied to H&N disease.
2. Materials and methods
2.1. Patient population
We performed a retrospective analysis of 30 patients with histological diagnosis of H&N cancer from June 2014 to December 2016. The patient classifications were: 15 with pharyngeal cancer (11 oropharynx, 2 rhinopharynx, 2 hypopharynx), 6 with laryngeal cancer, 6 oral cavity cancers, 2 with lymph nodes from unknown primary (CUP), 1 patient was excluded since PET revealed distant metastasis. The median age was 66.7 years (range 40-87 years), 27 were men and 3 were women. Pathologic findings confirmed squamous cell carcinoma for all patients. Tumour stage (T) was comprised between T2 and T4. Only 1 patient had T1. These patients underwent iter diagnostics including CT, magnetic resonance (RM), ultrasound (US) and other clinical examinations. After diagnostic staging, the patients were considered eligible for radiotherapy and underwent FDG-PET/CT to be used in radiotherapy treatment planning and also to complete the diagnostic investigation. PET/CT images were acquired on a DISCOVERY TM 710 PET/CT scanner (GE Healthcare) [18]. The images were reconstructed with OSEM 3D algorithms including PSF (Point Spread Function) and TOF (Time of Flight) and corrected for attenuation, scatter and decay. The exam was performed with an individualized thermoplastic mask including external markers as a reference for isocenter localization and patient positioning during the radiotherapy treatment. Of these patients, 29 were treated with intensity-modulated radiotherapy (IMRT) or volumetric modulated arc radiotherapy (VMAT) techniques. The patient with metastasis was excluded from radiotherapy.
2.2. Investigation methodology
In January 2017, we decided to reconsider the FDG-PET/CT examinations of these patients and we attempted to investigate the difference between radiotherapy planning including PET information and a radiotherapy treatment plan ignoring PET data and based on CT only. The methodology we adopted was the following: the PET/CT images were transferred from the archive system (PACS or PET database) to a MIM software workstation [19] usually used for radiotherapy contouring. PET and CT images were assessed separately by a well-trained radiation oncologist followed by analysis of the fused PET/CT images.
(1) First, the radiation oncologist contoured the primary tumour and the lymph nodes on the CT images blinded from PET data but comparing CT with all the other diagnostic imaging types (MRI, US, etc) and taking into account the clinical examinations. We considered the contoured volume obtained from this first delineation as the CT-GTV (CT-based gross tumour volume).
(2) Successively, PET images were fused to CT. On the fused images, the radiation oncologist delineated the most active tumour region as highlighted by the FDG uptake. This volume is defined as the biological target volume (BTV). Delineation of BTV was performed for both the primary tumour (BTVT) and lymph nodes (BTVN) using an adaptive thresholding method based on the source to background ratio. Contouring thresholds were calculated as a percentage of the maximum value of the Standard Uptake Value (SUVmax) and depended on the SUVmax/background ratio. The method was previously validated in phantom to obtain a specific calibration for our PET scanner as described in [20]. As concerns the lymph nodes, the radiation oncologist included in the target volume those appearing positive on PET (also assessed on CT or RM) and those negative on PET but suspected on CT and/or RM according to the criteria indicated in [21, 22]. Since PET imaging is affected by partial volume effects, in particular for small lesions, lynph nodes positive on PET with a diameter < 5mm were assessed also in CT and/or RM and included in the target if they presented a significant clinical suspicion.
We point out that target contouring was performed by only one radiation oncologist with considerable expertise in radiotherapy to avoid inter-observer variability.
The GTVs for the primary tumour and the lymph nodes were contoured on CT according to the DAHANCA, EORTC, HKNPCSG, NCIC CTG, NCRI, RTOG and TROG radiotherapy guidelines [23,24,25]. At completion of the contouring section, we performed a volumetric and a dosimetric analysis.
2.3. Analysis of the target volumes
CT-GTVs were compared with PET-GTVs using the methodology suggested in [26].
The following quantities were considered (Figure 1 a,b,c):
- the overlapping volume OV between PET-GTV and CT-GTV.
- the encompassing volume EV
- the overlap fraction OV-PET (ratio between OV and the PET-GTV)
- the overlap fraction OV-CT (ratio between OV and the CT-GTV)
- the overlap fraction OV-TOT (ratio between the OV and the encompassing volume EV)
- the discrepancy index DI (ratio between the EV and the OV; DI=1 in case of total overlap between PET/CT contours and CT contours and DI=∞ in case of total mismatch)
- the mismatch fraction MF-PET = (1 – OV – PET)
- the mismatch fraction MF-CT = (1 – OV – CT)
- the total mismatch fraction MF-TOT = (1 – OV – TOT)
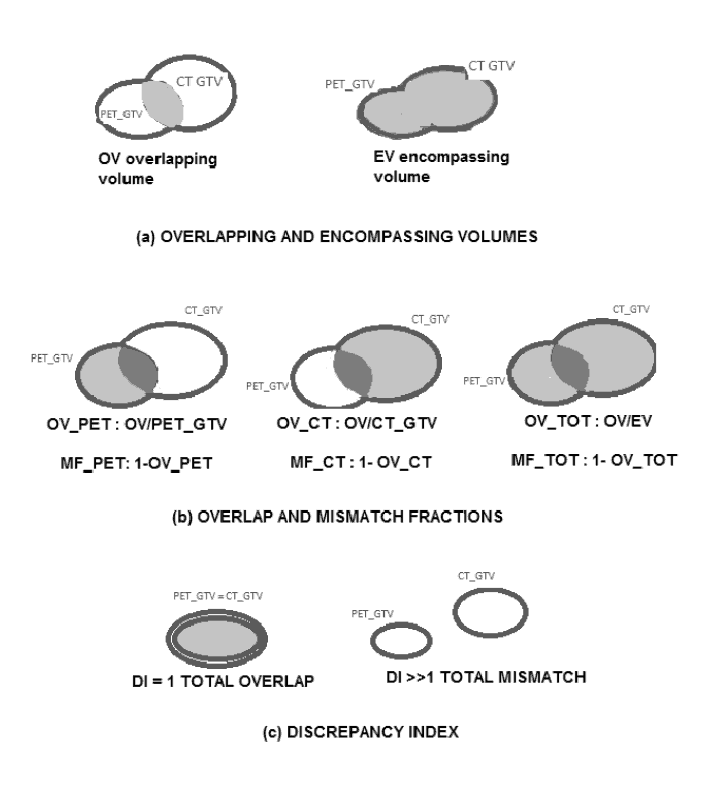
Figure 1. PET/CT and CT volume analysis.
The SUVmax values and the contouring thresholds were also reported.
2.4. Dosimetric analysis
For the dosimetric analysis, we developed a simulation treatment plan as explained below. CT-GTV was considered as the reference volume to be irradiated while the PET/CT-GTV, the BTVT and the BTVN were considered as ‘ghost’ volumes receiving a dose as a consequence of the CT-GTV irradiation. In particular, we were interested to evaluate the dose received by the BTVT/N since it represents the most aggressive tumour region. For this purpose, we developed a radiotherapy treatment plan ad-hoc with a 3-D conformal technique using two opposed beams of 6 MV with isocenter in the CT-GTVs (Figure 2).

Figure 2. Layout of a 3-D conformal treatment plan.
Radiotherapy treatment plans were developed using an ONCENTRA treatment planning system [27]. The dose to CT-GTV was 20 Gy for all patients. It was our choice to consider a simplified treatment planning technique and the same irradiation dose for all patients aimed to obtain a dosimetric evaluation independent from a patient-specific prescribed dose and treatment plan features. All treatment plans were developed by the same operator to avoid any inter-operator variability.
The dose delivered to the BTVT/N was determined from dose-volume histograms according to the following quantities:
- Dose covering 95% of the BTVs (D95%)
- Minimum and average dose to the BTVs (Dmin and Dav)
We considered that BTVs received an optimal irradiation if the following conditions were satisfied:
- D95% ≥ 95% of the dose released to CT-GTV
- Dmin: 95% of the dose released to CT-GTV (at least)
- Dav: 100% of the dose released to CT-GTV (at least)
Deviations from these conditions were calculated as:
- ΔD95% difference between D95% and the actual dose covering the 95% of the BTV
- ΔDmin difference between Dmin and the actual minimum dose to BTV
- ΔDav difference between Dav and the actual average dose to BTV
2.5. Statistical analysis
For descriptive statistical analysis we considered the minimum, maximum, median, mean and standard deviation values. Comparison between CT and PET/CT volumes were performed using the Wilcoxon signed-ranks test since these quantities are not normally distributed.
3. Results
3.1. Target volume analysis
For each patient we evaluated the SUVmax values of the lesions identified on PET images, the PET-GTVs, the BTVs and CT-GTVs. SUVmax values were spread between 3.3 g/mL and 52 g/mL, the mean patient background was about 1 g/mL. Contouring thresholds were in the range 20-41% of SUVmax for primary lesions and 20-50% for lymph nodes. The BTVT mean volume for primary lesions was 29.9±30.8 mL; while for lymph nodes, mean volume was 29.5±92.6 mL. The large mean value and standard deviation of lymph node volumes were caused by three patients having abnormally expanded lymph nodes (BTVN mean value excluding these patients was 2.4±3.9 mL). Comparison of PET-GTVs and CT-GTVs shows that the mean functional GTV is smaller than the mean anatomical GTV (75.3 mL versus 92.7 mL). Since PET/CT volumes are more precisely delineated around the FDG-avid tumour region, the mean fraction of OV-PET (see Figure 1.b) results were larger than the OV-CT (0.71 versus 0.54 with one-sided level of significance α=0.5% from the Wilcoxon Signed Rank Test). The mean fraction of OV-TOT was 0.44 and the mean fraction of MF-TOT was 0.56. The DI (5.4±10) was statistically significant with a one-sided level of significance α=0.5% from the Wilcoxon Signed Rank Test. The high values of MF-TOT and DI attest that there is a relevant discrepancy between PET/CT volumes and CT volumes.Table 1 resumes the descriptive parameters for the clinical cases.
Table 1. Descriptive parameters for the clinical cases.
3.2. Dose-volume histogram implications for the Biological Target Volumes
Dosimetric implications for the BTV(T/N) in case of a CT-based treatment plan were evaluated from dose-volume histograms. The differences between the actual doses released to BTVs and the optimal irradiation conditions considered for this study and reported in the previous section were calculated and shown in Table 2.
Pharyngeal (rhino-oro-hypo pharyngeal) cancer (15 patients)
BTVT mean dose difference (%)
ΔD95% ΔDmin ΔDav
Mean -24.3 -35.6 -5.8
S.D. 41.8 44.0 16.3
Min -96.5 -97.5 -55.2
BTVN mean dose difference (%)
ΔD95% ΔDmin ΔDav
Mean -41.2 -54.3 -20.3
S.D. 42.3 43.4 33.6
Min -99.1 -99.1 -98.7
Oral cavity cancer (6 patients)
BTVT mean dose difference (%)
ΔD95% ΔDmin ΔDav
Mean
-19.1 -31.1 -2.3
S.D.
34.2 44.3 5.3
Min -84.8 -94.7 -13.0
BTVN mean dose difference (%)
ΔD95% ΔDmin ΔDav
Mean
2.5 0.4 1.0
S.D.
2.4 4.2 2.1
Min
0.0 -5.3 -0.8
Laryngeal cancer (6 patients)
BTVT mean dose difference (%)
ΔD95% ΔDmin ΔDav
Mean 0.4 -5.7 0.5
S.D.
4.3 5.3 2.1
Min
-8.4 -14.0 -2.8
BTVN mean dose difference %
ΔD95% ΔDmin ΔDav
Mean 2.1 2.1 1.8
S.D. 2.6 2.9 2.7
Min -0.8 -2.2 -2.3
Table 2. Mean dose differences for BTVT and BTV.
The Δ95% dose differences for BTV(T/N) are shown in Figures 3-4.
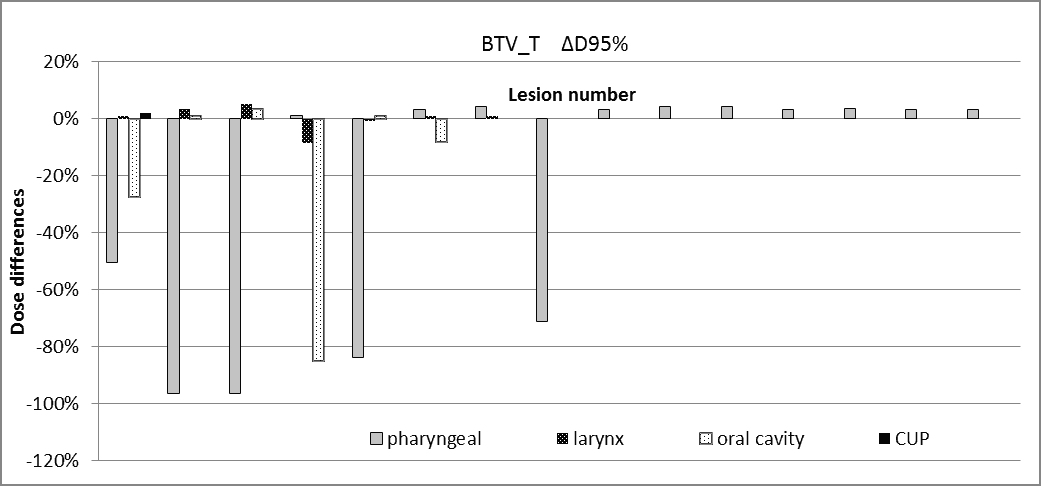
Figure 3. Dose differences for BTVT.
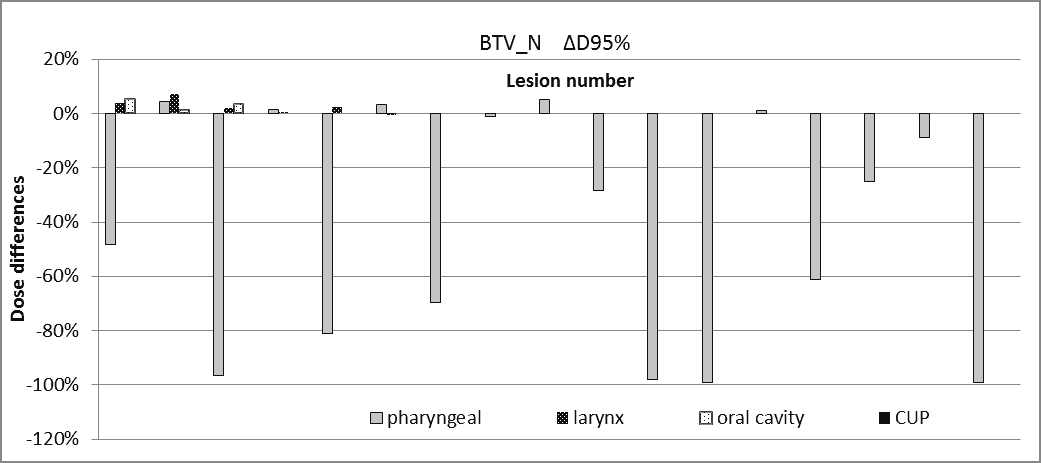
Figure 4. Dose differences for BTVN.
The dosimetric findings for BTVT/N obtained from the simulated CT-based treatment plan is resumed as follows:
- 23% of the patients had underdosages on the BTVT with ΔD95% in the range of (-96.5% to -27.4%)
- 33% of the patients had underdosages on the BTVN with ΔD95% in the range of (-99.1% to -25.1%)
- 37% of the patients had underdosages on the BTVT or BTVN with ΔD95% ≤ -25%
- ΔDav of BTV(T/N) was < -10% in 30% of the patients
- In pharyngeal cancer, ΔD95% of the BTVT is in the range (0 to -96.5%; mean -24.3%) and ΔD95% of the BTVN is in the range (0 to -99.1%; mean -41.2%).
- In oral cavity cancer, ΔD95% of the BTVT is in the range (0 to -84.8%; mean -19.1%), while for the BTVN no significant underdosages were reported probably because the number of malignant lynph nodes in these patients was low.
Considering the lesion numbers (29 primary/CUP cancer lesions and 29 lynph nodes):
- 23% of the BTVT lesions have underdosages with ΔD95% in the range (-27.4 to -96.5%)
- 34.5% of the BTVN lesions have underdosages with ΔD95% in the range (-25.1% to -99.1%)
4. Discussion and conclusions
The results of the volumetric analysis showing that the mean PET-based GTV is smaller than the mean CT-based GTV is consistent with other studies reported in the literature. In the pioneering investigation of Daisne et al., it was demonstrated that GTV delineated from 18F-FDG PET was closest to the pathologic volume from surgical specimens, and smaller than GTV delineated by CT and MRI [11]. Schinagl et al. [28] and Figuereido et al. [29] also showed that CT-based GTV was larger than a PET-based GTV obtained with a source to background segmentation method.
However, Schinagl et al. in the same study demonstrated that the volume and shape of PET-GTV heavily depends on the segmentation algorithm. So far, to our knowledge, a standardized segmentation method to obtain GTVs from PET data is not yet available; but as indicated in [11–13], an automatic segmentation tool is highly recommended. In this work, we used a thresholding segmentation method – based on source to background ratio – to delineate the biological target volume. Our choice to use an adaptive thresholding segmentation was supported by the fact that the method was previously validated in a phantom study that obtained a specific calibration for our PET scanner [20].
The high values of MF-TOT (0.56) and DI (5.44) resulting from the present work confirms a discrepancy between PET-based GTVs and CT-based GTVs. These findings might attest that PET identifies tumour regions missed with CT. However, it is important to underline that PET has two main limitations: the inability to detect small lesions (< 5 mm in diameter) and false positive findings due to peritumoral inflammation. Lesions with dimensions lower than PET resolution could therefore be underestimated and the mismatch between PET and CT volumes could represent a geographical miss of CT-GTV, but also a false positive PET finding due to inflammation.
Unfortunately, without a comparison with pathology specimens, we are not able to establish which contour is the most reliable. In literature studies, comparing PET, MRI and CT scans with the histopathology of resected tumour specimens shows that none of these three imaging modalities is 100% accurate. However, PET appears to be the most accurate of the three. Tumour volume determined by PET tends to be smaller on average than the volume determined by the other modalities, but most closely approximates the true tumour volume [11].
The discrepancy between PET-GTVs and CT-GTVs also affects dosimetric issues related to the radiotherapeutical treatment. We demonstrated by simple simulation that the BTVT/BTVN might result in underdosage in a treatment plan which is CT-based. The most severe underdosages of BTVT/N were observed in pharyngeal and oral cancer; while in laryngeal cancer no significant dose differences (within ± 5%) were reported. 23% of the analysed BTVT and 34.5% of the analysed BTVN had underdosages less than -25%. These results may be explained by the fact that the overlapping between CT volumes and PET volumes are similar to those represented in Figure 2. Here the BTVT/BTVN are not visible on CT alone and therefore they risk being partially or totally obscured by the multileaf collimator in a CT-based treatment plan. These dosimetric findings emphasize the importance of a reliable PET segmentation tool for the correct identification of BTVs. We are conscious that these results are limited to the restricted and heterogeneous population analysed in this work.
Other limitations are represented by the poor PET resolution and the false positive findings. In spite of these pitfalls, we are reasonably confident that:
(1) incorporation of PET information in the GTVs delineation translates to a reduction of the high dose volumes and helps in sparing the surrounding tissues as already asserted in [17];
(2) PET data might identify a tumour region not clearly visible on CT and prevent it from geographical missing, especially in pharyngeal or oral cavity disease, while improving the dosimetric coverage of the tumour extent.
Following these considerations, we have decided to include an FDG-PET/CT examination in the clinical protocol of patients with H&N disease that are candidates for radiotherapy and to integrate all the information deriving from clinical examinations and from other diagnostic modalities such as CT or CE-CT, MRI and US.
Ethical consideration statement
An informed consent about the use of the clinical data in retrospective studies was signed by all patients considered in this study.
Conflict of interest
The authors confirm that this article content has no conflict of interest.
References
Key References: 11, 17, 27, 28
- Roh JL, Yeo NK, Kim JS, et al. Utility of 2-[18F] fluoro-2-deoxy-D-glucose positron emission tomography and positron emission tomography/computed tomography imaging in the preoperative staging of head and neck squamous cell carcinoma. Oral. Oncol. 2007; 43: 887-893.CrossRef PubMed
- Baek CH, Chung MK, Son YI, et al. Tumor volume assessment by 18F-FDG PET/CT in patients with oral cavity cancer with dental artifacts on CT or MR images. J. Nucl. Med. 2008; 49: 1422-1428.CrossRef PubMed
- Czernin J, Allen-Auerbach M, Schelbert HR. Improvements in cancer staging with PET/CT: literature-based evidence as of September 2006. J. Nucl. Med. 2007; 48 (Suppl 1): 78S-88S.PubMed
- Connell CA, Corry J, Milner AD, et al. Clinical impact of. and prognostic stratification by. F-18 FDG PET/CT in head and neck mucosal squamous cell carcinoma. Head Neck. 2007; 29: 986-995.CrossRef PubMed
- Mak D, Corry J, Lau E, et al. Role of FDG-PET/CT in staging and follow-up of head and neck squamous cell carcinoma. Q. J. Nucl. Med. Mol. Imaging. 2011; 55: 487-499.PubMed
- Gregoire V, Chiti A. Molecular imaging in radiotherapy planning for head and neck tumors. J. Nucl. Med. 2011; 52: 331-334.CrossRef PubMed
- Arens AI, Troost EG, Schinagl D, et al. FDG-PET/CT in radiation treatment planning of head and neck squamous cell carcinoma. Q. J. Nucl. Med. Mol. Imaging. 2011; 55: 521-528.PubMed
- Rusthoven KE, Koshy M, Paulino AC. The role of fluorodeoxyglucose positron emission tomography in cervical lymph node metastases from an unknown primary tumor. Cancer. 2004; 101: 2641-2649.CrossRef PubMed
- Johansen J, Petersen H, Godballe C, et al. FDG-PET/CT for detection of the unknown primary head and neck tumor. Q. J. Nucl. Med. Mol. Imaging. 2011; 55: 500-508.PubMed
- Wong WL, Sonoda LI, Gharpurhy A, et al. 18F-fluorodeoxyglucose positron emission tomography/computed tomography in the assessment of occult primary head and neck cancers: an audit and review of published studies. Clin. Oncol. (R. Coll. Radiol.). 2012; 24(3): 190-195.CrossRef PubMed
- Daisne JF, Duprez T, Weynand B, et al. Accuracy of CT scan, MRI and FDG-PET in delineating the tumor volume in pharyngo-laryngeal squamous cell carcinomas treated by radiotherapy: Validation with the macroscopic tumor specimen used as reference. Radiology. 2004; 233: 93-100.CrossRef PubMed
- Geets X, Daisne JF, Tomsej M, Duprez T, Lonneux M, Grégoire V. Impact of the type of imaging modality on target volumes delineation and dose distribution in pharyngo-laryngeal squamous cell carcinoma: comparison between pre- and per-treatment studies. Radiother. Oncol. 2006 Mar; 78(3): 291-297.CrossRef PubMed
- Geets X, Lee JA, Bol A, et al. A gradient-based method for segmenting FDG-PET images: methodology and validation. Eur. J. Nucl. Med. Mol. Imaging. 2007 Sep; 34: 1427–1438.CrossRef PubMed
- Rembielak A, Price P. The role of PET in target localization for radiotherapy treatment planning. Onkologie. 2008; 31: 57–62.CrossRef PubMed
- Nestle U, Weber W, Hentschel M, Grosu AL. Biological imaging in radiation therapy: role of positron emission tomography. Phys. Med. Biol. 2009; 54: R1-25.CrossRef PubMed
- Zaidi H, El Naqa I. PET-guided delineation of radiation therapy treatment volumes: a survey of image segmentation techniques. Eur. J. Nucl. Med. Mol. Imaging. 2010; 37: 2165–2187.CrossRef PubMed
- Leclerc M, Lartigau E, Lacornerie T, Daisne JF, Kramar A, Grégoire V. Primary tumor delineation based on (18)FDG PET for locally advanced head and neck cancer treated by chemo-radiotherapy. Radiother. Oncol. 2015 Jul; 116(1): 87-93.CrossRef PubMed
- Bettinardi V, Presotto L, Rapisarda E, et al. Physical performance of the new hybrid PET/CT Discovery-690. Med. Phys. 2011 Oct; 38 (10): 5394-5411.CrossRef PubMed
- MIM version 6.5.2 (MIM Software Inc. Cleveland. Ohio).
- Ferrando O, Foppiano F, Scolaro T, et al. PET/CT images quantification for diagnostics and radiotherapy applications. J. Diagn. Imaging Ther. 2015; 2(1): 18-29.CrossRef
- Som P. Detection of metastasis in cervical lymph nodes: CT and MR criteria and differential diagnosis. AJR Am. J. Roentgenol. 1992 May; 158(5): 961-969.CrossRef PubMed
- Van den Brekel MW, Stel HV, Castelijns JA, et al. Cervical lymph node metastasis: assessment of radiologic criteria. Radiology. 1990 Nov; 177(2): 379-384.CrossRef PubMed
- Grégoire V, Levendag P, Ang KK, et al. CT-based delineation of lymph node levels and related CTVs in the node-negative neck: DAHANCA. EORTC. GORTEC. NCIC.RTOG consensus guidelines. Radiother. Oncol. 2003 Dec; 69(3): 227-236.CrossRef PubMed
- Grégoire V, Eisbruch A, Hamoir M, et al. Proposal for the delineation of the nodal CTV in the node-positive and the post-operative neck. Radiother. Oncol. 2006 Apr; 79(1): 15-20.CrossRef PubMed
- Grégoire V, Ang K, BudachW, et al. Delineation of the neck node levels for head and neck tumors: a 2013 update. DAHANCA, EORTC, HKNPCSG, NCIC CTG, NCRI, RTOG, TROG consensus guidelines. Radiother. Oncol. 2014 Jan; 110(1): 172-181.CrossRef PubMed
- ONCENTRA Master Plan version 4.5.2 (Elekta AB. Stockholm).
- Perez-Romasanta LA, Bellon-Guardia M, Torres-Donaire J, et al. Tumor volume delineation in head and neck cancer with 18-fluor-fluorodeoxiglucose positron emission tomography: adaptive thresholding method applied to primary tumors and metastatic lymph nodes. Clin. Transl. Oncol. 2013;15: 283–293.CrossRef PubMed
- Schinagl DA, Vogel WV, Hoffmann AL, et al. Comparison of five segmentation tools for 18F-fluoro-deoxy-glucose-positron emission tomographybased target volume definition in head and neck cancer. Int. J. Radiat. Oncol. Biol. Phys. 2007 Nov 15; 69(4):1282-1289.CrossRef PubMed
- Henriques de Figueiredo B, Barret O, Demeaux H, et al Comparison between CT- and FDG-PET-defined target volumes for radiotherapy planning in head-and-neck cancers. Radiother. Oncol. 2009. 93: 479-482.CrossRef PubMed
Article information
Corresponding author: Ornella Ferrando.
Copyright: © 2018 Ferrando O et al.
How to cite: Ferrando O, Scolarob T, Ciarmiello A, Foppiano F. Target volume definition and dosimetric issues in radiotherapy treatment of head and neck disease with FDG-PET/CT: A monocentric experience. J. Diagn. Imaging Ther. 2018; 5 (1): 14-19 (https://dx.doi.org/10.17229/jdit.2018-0223-031).
Article history: Received 31 January 2018; Accepted 21 February 2018; Published online 23 February 2018.
Archive link: JDIT-2018-0223-031
home »