RESEARCH ARTICLE
Ornella Ferrandoa,*, Alessandro Chimenza, Franca Foppianoa, Andrea Ciarmiellob
aMedical Physics Department
bNuclear Medicine Department. S. Andrea Hospital, La Spezia, Italy
Abstract
Aim of this work is the calibration of a SPECT-CT scanner (SYMBIA T2 – SIEMENS) for activity quantification in 99mTc-macroaggregated albumin (99mTc-MAA) clinical acquisitions used for radiation dosimetry before radioembolization. Materials and methods: SPECT/CT calibration was performed using the methodology proposed by Zeintl et al [1]. A calibration factor converting cps (counts per second) to activity was determined using a uniform radioactive solution in a cylindrical water phantom. Recovery coefficients, background variability and contrast were obtained from acquisitions of an IEC NEMA torso-phantom with hot sphere inserts. 99mTc was used to prepare the radioactive solutions and different sphere-to-background ratio (RSB). The phantom was acquired using the 99mTc-MAA clinical protocol. Images were reconstructed with the proprietary OSEM 3D algorithm (FLASH 3D, Siemens Healthcare), scatter and attenuation correction. The phantom results were validated on 99mTc-MAA in vivo patient acquisitions. Results: The calibration factor for 99mTc was 464.8 cps/MBq. Recovery coefficients vary with sphere volumes from 90% to 20%. Hot sphere contrast and activity quantification improve with higher iterations and subsets while the sphere to background ratio and the background variability increase. A balance between a satisfactory activity recovery and a low background variability (<12%) was obtained with 8 iterations, 8 subsets and no filtering. Hot spheres activity was determined with an accuracy ≤7%. Activity in liver from 99mTc-MAA patient acquisitions was 8% (mean value) which was less than the administrated activity to the patients. This underestimation was attributed to some extrahepatic shunt. Conclusions: Activity recovery using the tested scanner can be achieved within an accuracy of 7%. With a simple scanner calibration procedure, the parameters of the clinical 99mTc protocols can be optimized improving image quality and activity recovery according to the clinical requirements.
Keywords: SPECT-CT; activity quantification; quantitative SPECT; calibration; dosimetry; protocol optimization
1. Introduction
SPECT has traditionally considered a non-quantitative imaging modality. However, the latest generation of SPECT/CT scanners has made quantitative SPECT practicable thanks to the implementation of new computational features such as attenuation, scatter, resolution recovery and dead time corrections. Image reconstruction, which was traditionally performed by filtered back projection, is now based on iterative methods. OSEM (Ordered Subset Expectation Maximization) algorithm is the method of choice used in hybrid scanner technology. In iterative methods image reconstruction is determined by different parameters such as iteration numbers, subsets and post-smoothing filter. As demonstrated in previous studies [2,3,4] the combination of iteration/subsets and post-smoothing affect the activity quantification and the image noise. Increasing the iterations and subsets improves the activity recovery but make images noisy and not applicable in clinical practice. Therefore, an appropriate knowledge of the quantification capability of the scanner used in daily clinical practice is mandatory to assess a correct activity quantification and the highest image quality. As shown in literature [5], quantitative SPECT may have various clinical applications. In vivo quantification of 99mTc acquisitions can be achieved with an accuracy of about ±10% as reported in [5] and references therein; more challenging is quantitative SPECT with other radioisotopes. From our side we used SPECT quantification applied to 99mTc-MAA acquisition to estimate radiation dosimetry in selective internal radionuclide therapy before radioembolization. For this reason, we investigated the quantification performance of our SPECT/CT scanner (SYMBIA T2 – SIEMENS). The aim of the work was the scanner calibration and the absolute activity quantification (with 99mTc) both in phantom and in vivo acquisitions. To perform the study, we used the methodology proposed by Zeintl et al [1]. The procedure consists of the calibration of the scanner which was achieved by phantom studies. Accuracy in activity definition is assessed using appropriate torso-phantom acquisitions with hot spheres simulating lesions of different dimensions. Phantom results were used to evaluate the activity in liver lesions for 8 99mTc-MAA patient acquisitions
2. Materials and methods
2.1. Methodology
We used a uniform cylindrical phantom with a volume of 5680 mL and an IEC NEMA torso-phantom [6] containing six spheres of different volumes (25.5 mL, 11.9 mL, 5.5 mL, 2.5 mL, 1.5 mL, 0.5 mL) and a lung insert. 99mTc was used to prepare the radioactive solutions filling the phantoms and the spheres. Phantom acquisitions were performed on a SPECT/CT SYMBIA T2 scanner (SIEMENS Healthcare) equipped with a low-energy and high-resolution collimator. Images were reconstructed using the proprietary OSEM 3D algorithm with resolution recovery (FLASH 3D, Siemens Healthcare), CT-based attenuation correction, energy window-based scatter. The attenuation map was generated from a CT scan of the phantoms with 130 kV, 30 mAs and a reconstruction kernel B08s (Siemens Healthcare). Phantom volume analysis and count statistics were performed using the proprietary software Volumetric Analysis (Siemens Healthcare).
The work is subdivided in four steps:
1) the SPECT/CT calibration using the uniform cylindrical phantom;
2) the activity quantification using the IEC phantom with hot spheres and hot background;
3) the activity quantification using the IEC phantom with a hot insert consisting of a 10 mL vial containing 9.99 MBq of 99mTc and an orange fruit injected with 1 mL of 99mTc (15.9 Mbq). For simplicity in this test we used a cold background. The radioactive orange fruit was inserted with the aim to test a non-uniform activity distribution;
4) the phantom results were extended to 99mTc-MAA patient acquisitions for quantification of the activity accumulated in liver lesions.
2.2. SPECT/CT calibration
System calibration consists in the definition of an experimental factor (S) relating the count rate (cps) and the activity (MBq) contained in a tridimensional volume. This can be achieved by acquisition of a phantom filled with a known activity concentration. In our case, system calibration was performed using a cylindric phantom of 5680 mL filled with a uniform dilution of 99mTc (196.1 MBq, about 127 million of total counts). An isocontour acquisition was performed with 120 projections (10 sec per projection), 128 x128 matrix, 2 separate energy windows for the acquisition of the photopeak and the lower scatter range (amplitude 20%). SPECT data were reconstructed with OSEM-3D algorithm, resolution recovery (FLASH 3D), 8 iterations, 5 subsets, 8.4 mm Gaussian filter, scatter and attenuation correction. These are the standard parameters used for clinical data reconstruction.
The calibration factor S of the system is calculated by the formula:

Where CT are the total counts per unit time (cps) in the phantom and AT is the actual activity at the calibration time. Counts and activity are corrected for radioactive decay. Total counts were determined drawing a VOI around the phantom boundaries.
2.3. Activity quantification
To evaluate the accuracy of SPECT quantification we performed a phantom study using the IEC NEMA phantom with six spheres of different volumes (from 0.5 mL to 25.5 mL). Different sphere-to-background ratio (Rs/b) were used (61:1, 44:1, 33:1, 10:1). The data were acquired with the phantom centred in the machine field of view using an isocontour acquisition over 360 degrees with 120 projections (10 sec each). We used a LEHR collimator with 4.8 mm pixel. SPECT data were reconstructed using a OSEM-3D algorithm as specified before. Four different reconstructions were performed with the following iterations/subsets/filter settings: 8it 5subsets 8.4 mm filter, 8it 5subsets No filter, 8it 8subsets No filter, 8it 16subsets No filter. The data was corrected for scatter and attenuation. The counts in the phantom spheres were calculated drawing a spherical VOI superimposed to the sphere volume determined following the CT boundaries. The absolute activity Aj for an object of size Sj was calculated from the relation:

Where Cj is the counting rate in the object j and S is the calibration factor calculated in the previous section. The sphere-to-background ratio (Rs/b) and the background variability (CV) were calculated as:


Cmax is the maximum voxel value in the sphere of 25.5 mL. The background mean value is determined as the mean value from 10 ROIs placed in the background and the SD is the mean SD of these 10 ROIs. The hot sphere contrast is defined as:

Csph is the measured activity concentration in the sphere with maximum diameter, Cbk is the background activity concentration calculated as the mean value of 10 ROIs placed in the background. and are the true concentration in the spheres and in the background. To quantify the spillover of activity outside the sphere boundaries and the consequent activity underestimation, we determined the recovery coefficients as:

Where Asph is the activity measured in the spheres and Atrue is the true activity filling the spheres.
2.4. In vivo patient analysis
The phantom results were extended to 99mTc-MAA patient acquisitions. MAA examinations were performed prior to 90-Y radioembolization with an injection of 99mTc in the range (150÷180) MBq for each liver branch. 99mTc-MAA was injected via intra-arterial administration in one or both liver lobes depending on disease extension. In absence of extra-hepatic shunts activity injected in the liver can be measured from counts collected in the tumour region and applying Equation (1). Lesions were contoured drawing a VOI as shown in Figure 1 and the accumulated counts were determined using the Volumetric Analysis Software (Siemens Healthcare). The contouring algorithm is based on an adaptive thresholding method based on the source to background ratio. Contouring thresholds were calculated as a percentage of the maximum voxel value. Patient data was acquired using 120 projections (360-degree acquisition range), two energy windows for photo-peak and lower scatter acquisition, attenuation map from CT scan. SPECT field of view was centred on the patient abdominal region containing the liver. Image data was reconstructed with OSEM-3D algorithm (Flash 3D, Siemens Healthcare) with 8 iterations/8 subsets, no Gaussian filter, CT-bases attenuation correction and energy window-based scatter correction.
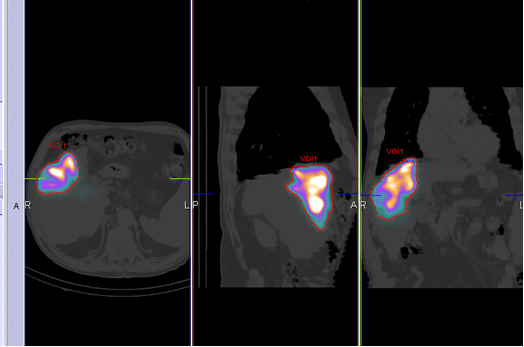
Figure 1. 99mTc-MAA acquisitions.
3. Results
3.1. SPECT/CT calibration
The calibration factor obtained from the uniform cylindrical phantom was S: 464.8 cps/MBq. This value was used for absolute activity calculation applying Equation (1).
3.2. Activity quantification (with hot spheres and hot background)
The effects of object size and reconstruction parameters are shown in Figure 2 and Figure 3. Figure 2 reports the recovery coefficients for different sphere volumes, Rs/b=10.5 and four combinations of iterations/subsets/filter. Recovery coefficients vary from 90% for volumes ≥ 25 mL to 20% for volumes up to 0.5 mL. Activity recovery improved if no smoothing filter and a higher number of updates (iterations x subsets) are applied in the reconstruction process.
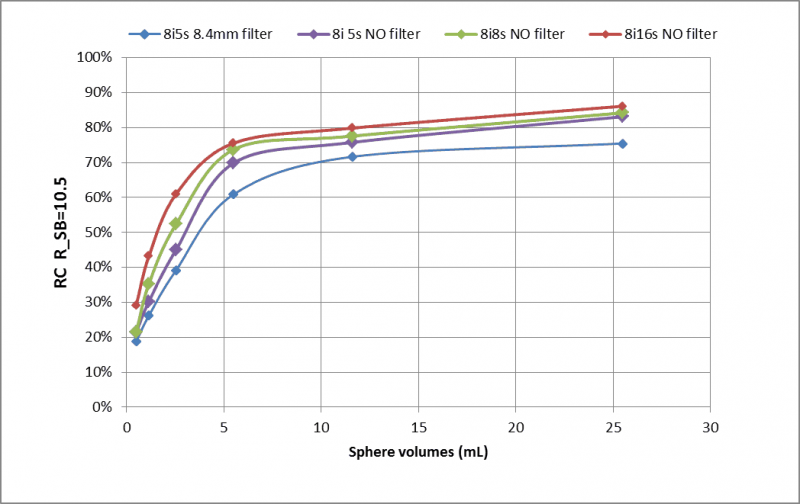
Figure 2. Recovery coefficient for a sphere-to-background ratio Rs/b =10.5 and different iterations, subsets and Gaussian filter.
Figure 3 and Table 1 report the recovery coefficients for different Rs/b and 8iterations/8subsets/No filter.
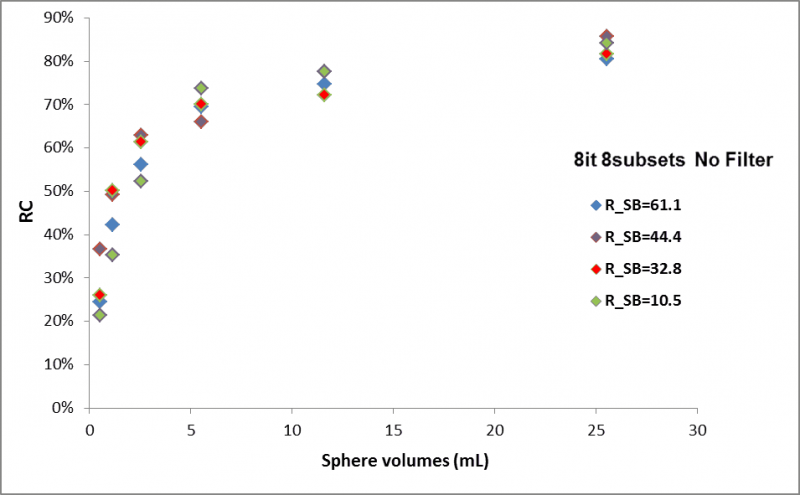
Figure 3. Recovery coefficient for different ratio Rs/b (8it 8 subsets and No Filter).
Table 1. Recovery Coefficients for 8it/8 subsets/ no filter and different Rs/b.
The Sphere-to-background ratio, the background variability and the hot sphere contrast are shown in Figures 4–6.
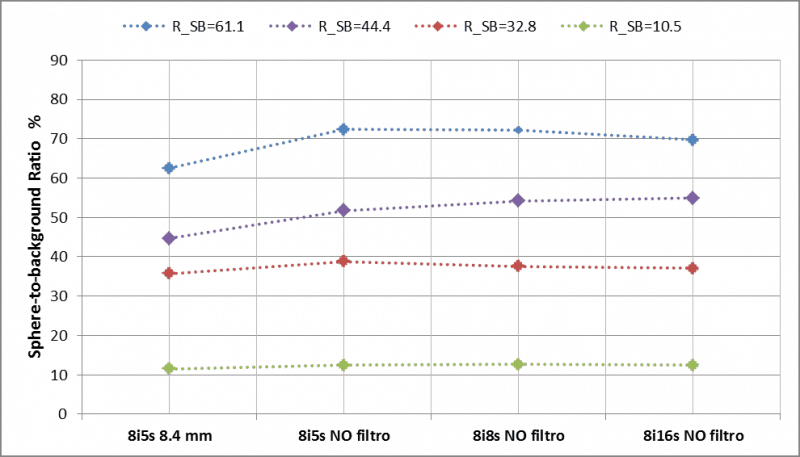
Figure 4. Sphere-to-background ratio for different reconstruction parameter sets.
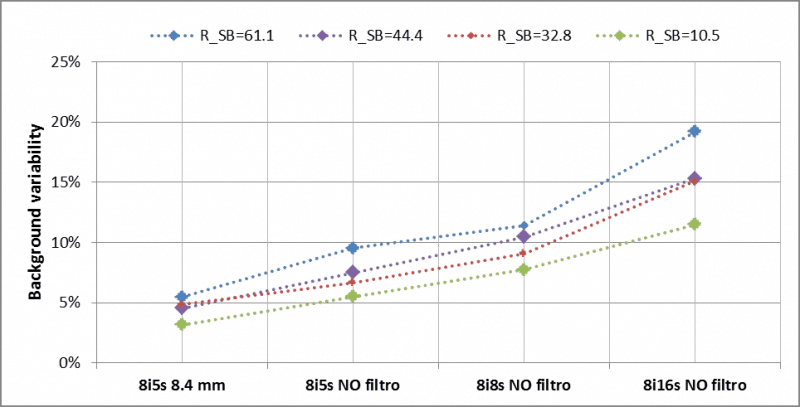
Figure 5. Background variability for different ratio R and reconstruction parameter sets.
Activity quantification and hot sphere contrast improve for higher update number (iteration number x subset number) and no Gaussian filter included in the image reconstruction (see Figure 3 and Figure 6). Better quantification is possible for larger sphere volumes (≥ 25 mL) where the effect of activity spill in and spill out are less important. The ratio Rs/b is less influenced by the update numbers while the background variability increases with the iteration/subset number (see Figure 5). A balance between a satisfactory activity recovery and a low background variability (<12%) was obtained with 8 iterations, 8 subsets and no filtering. Applying these reconstruction parameters, the recovered activities in the hot spheres were determined for all phantom acquisition with a mean error ≤7.2%. From this analysis, we conclude that the optimal reconstruction parameters are: OSEM-3D algorithm, resolution recovery 64 update number (8 iterations and 8 subsets) and no post-smoothing filtering.
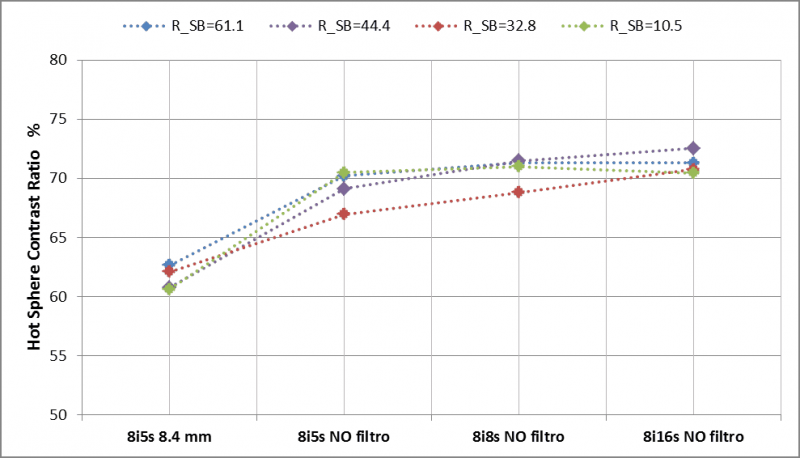
Figure 6. Hot sphere contrast.
3.3. Activity quantification (with vial hot insert and radioactive orange fruit)
The activity measured in the vial was 9.62 MBq with a difference of -3% with respect to the injected activity. The activity in the orange fruit was 14.8 MBq (7% less than the injected activity). The activity in the orange fruit was slightly inferior to the injected activity because of some leakage from the injection site.
3.4. Patient data analysis
The recovered activity of 8 in vivo patient 99mTc-MAA acquisitions are reported in Table 2. Patient images were reconstructed using the optimized parameter settings obtained with the previous phantom studies (8 iterations, 8 subsets and no filter). The liver lesions were contoured as shown in Figure 1 and the total counts were recorded. The absolute activity was then calculated from equation (1) and corrected with the recovery coefficients extracted from Table 1.
Table 2. Injected and Measured activity in 99mTc-MAA liver acquisitions.
The injected activity and the residual activity in the syringe were measured respectively before and after injection in a dose calibrator (±1%). Residual activity in the intra-arterial catheter was also evaluated. The difference between injected and measured activity was in the range (-11% ÷ -5%). This discrepancy can be explained by the fact that a small part of macro-aggregates tends to separate from 99mTc, therefore a percentage of activity flow from the liver towards other abdominal organs causing a loss of activity in the liver lesions.
4. Discussion and conclusions
In this work, we tested the quantitative performance of our SPECT/CT scanner using the procedure suggested in [1]. Our results show that activity quantification in 99mTc phantom acquisitions with hot inserts can be achieved with an accuracy of about 7%. This value is comparable with the accuracy measured by Zeintl et al. in [1]. Since activity quantification is affected by partial volume effects, the recovery coefficients for different source to background ratios were determined with an accuracy within 5%. The hot sphere phantom was acquired using the 99mTc-MAA clinical protocol. Optimized reconstruction parameters were determined (8 iterations/8 subsets/no filter) and then applied to reconstruction of 99mTc-MAA in vivo liver acquisitions. The recovered activity measured in the patient livers resulted in an underestimation of about -8% (averaged over all patients) with respect to the actual injected activity. We attributed this underestimation to some activity flow towards the abdominal regions outside the SPECT field of view. The results obtained with patient acquisitions were in accordance with those presented in a similar work by Gnesin S. et al in [7]. In summary with this study we verified that our scanner may quantify 99mTc SPECT/CT acquisitions with a good accuracy using a simple calibration method. Here we used the spect calibration to optimize the clinical protocol of 99mTc-MAA in-vivo liver acquisition and to quantify the activity in liver lesions: for the future, the same method might be extended to optimize other clinical 99mTc protocols.
Conflicts of interest
This research did not receive any specific grant from funding agencies in the public, commercial, or not-for-profit sectors.
Ethical consideration statement
Informed consent about the use of the clinical data in retrospective studies was signed by all patients considered in this study.
References
- Zeintl J, Vija AH, Yahil A, Hornegger J, Kuwert T. Quantitative accuracy of clinical 99mTc SPECT/CT using ordered-subset expectation maximization with 3-dimensional resolution recovery, attenuation, and scatter correction. J. Nucl. Med. 2010; 51(6): 921-928.CrossRef PubMed
- Miller TR, Wallis JW. Clinically important characteristics of maximum-likelihood reconstruction. J. Nucl. Med. 1992; 33(9): 1678-1684.PubMed
- Kappadath SC. Effects of voxel size and iterative reconstruction parameters on the spatial resolution of 99mTc SPECT/CT. J. Appl. Clin. Med. Phys. 2011; 12(4): 3459.CrossRef PubMed
- Frey EC, Humm JL, Ljungberg M. Accuracy and precision of radioactivity quantification in nuclear medicine images. Semin. Nucl. Med. 2012; 42(3): 208-218.CrossRef PubMed
- Bailey DL and Willowson KP. An evidence-based review of quantitative SPECT imaging and potential clinical applications. J. Nucl. Med. 2013; 54(1): 83-89.CrossRef PubMed
- Nema IEC Body Phantom Set™. Data Spectrum Corporation.Reference Source
- Gnesin S, Ferreira PL, Malterre J et al. Phantom Validation of Tc-99m Absolute Quantification in a SPECT/CT Commercial Device. Comput. Math. Methods Med. 2016: 4360371.CrossRef PubMed
Article information
Corresponding author: Ornella Ferrando.
Copyright: © 2018 Ferrando O et al.
How to cite: Ferrando O et al. SPECT/CT Activity Quantification in 99mTc-MAA Acquisitions. J. Diagn. Imaging Ther. 2018; 5(1): 32-36 (https://dx.doi.org/10.17229/jdit.2018-0624-034).
Article history: Received 11 June 2018; Accepted 19 June 2018; Published online 24 June 2018.
Archive Link: JDIT-2018-0624-034
home »