RESEARCH ARTICLE
Ornella Ferrando1,*, Franca Foppiano1, Tindaro Scolaro2, Chiara Gaeta3, Andrea Ciarmiello3
1Medical Physics Department, S. Andrea Hospital, La Spezia, Italy
2Radiotherapy Department, S. Andrea Hospital, La Spezia, Italy
3Nuclear Medicine Department, S. Andrea Hospital, La Spezia, Italy
Abstract
Background: In our Institute PET/CT images are used for detecting, staging and monitoring various malignant tumours. Standard Uptake Value (SUV) is now commonplace in our clinical PET/CT oncology. Moreover, PET images are used for target volume definition in radiotherapy applications. Even if PET represents a powerful diagnostics tool, the quantitative data extracted from PET are affected by the limited resolution of the system. The aims of this work is to analysed by a phantom study the accuracy of the data quantified by our tomograph and the validation of the segmentation method used for radiotherapy applications.
Methods: The phantom study was performed on a PET/CT system using the IEC Phantom with spheres filled with different sphere/background activity ratios (RS/B). Sphere volumes were determined using an adaptive thresholding method. SUV assessment was evaluated measuring the SUV values in each sphere and the percentage error respect to the true value. Hot Contrast Recovery Coefficients (HCRC) were also measured.
Results: A linear relationship between thresholds and volumes was observed for volumes up to 10 mL. Between 10 mL and 5.5 mL thresholds decrease reaching a minimum at 1.1 mL. For volumes <1.1 mL thresholds increase exponentially. No dependence on the acquisition time was observed but thresholds depend on sphere volumes, RS/B and smoothing filter. SUV is quantified for volumes up to 2.5 mL with an underestimation of 10%, for smaller dimensions SUV values are underestimated up to 80%. Hot Contrast Recovery Coefficients range from 87% to 16%.
Conclusions: For objects with very small volume (<2.5 mL) the SUV values are affected by a significant error (up to 80%). From the clinical point of view this means that very small lesions with low measured SUVmax might represent a false negative. Moreover, the limited PET resolution influences lesion segmentation: the adaptive thresholding method is an useful tool for tumour boundary definition but it may provide unreliable results for volumes less than 2.5 mL.
Keywords: Positron emission tomography; Quantitative approaches; Segmentation; SUV
1. Introduction
PET/CT has revolutionized medical diagnosis in many fields, by adding precision of anatomic localization to functional imaging. The benefits of PET/CT images in the entire spectrum of cancer care, from diagnosis and treatment planning to evaluation of treatment responses, have come into focus in recent years as the technology has become a standard practice [1,2]. Moreover PET images are increasingly used in Radiotherapy to define the tumour boundaries [3]. High precision Radiotherapy requires accurate tumour volume definition. Target volume contouring is usually based on the anatomic information acquired with Computerized Tomography (CT) or Magnetic Resonance (MR).
In the last years the introduction of PET in combination with CT provides a better definition of the Biological Target Volume (BTV) and therefore improves tumour localization and delineation [4,5,6]. However partial volume effects [7] caused by the limited spatial resolution of the imaging system affects quantification of PET data. These effects and also the parameters used in image reconstruction influence the segmentation methods used to define the tumour boundaries and the quantification of the activity uptake in terms of Standardized Uptake Values and as consequence the tumour assessment.
For all these reasons, before using PET images in Diagnostics and Radiotherapy applications, it is important to analyze the influence of partial volume effects and image reconstruction parameters on PET data quantification.
In our Institute PET/CT images are used for detection and staging of various malignant tumours, monitoring of their response to therapy and also for Radiotherapy tumour volume definition. For detection, staging and monitoring SUVmax values are used to define the pathologic relevance of a lesion.
For Radiotherapy applications the definition of the biological target volume (BTV) relies on automatic segmentation of PET images using an adaptive thresholding method based on tumour/background ratios [8,9,10].
Aim of this study is to define with a phantom study the actual contouring thresholds to be used in tumour boundary definition and to evaluate the accuracy of PET data quantification in our tomograph.
2. Materials and methods
The study was performed on a DISCOVERY TM 710 PET/CT scanner (Ge Healthcare) [11]. The system has lutetium orthosilicate detectors covering an axial FOV of 16.2 cm and a transaxial FOV of 70 cm in diameter. PET data were acquired in 3D-mode. The image matrix was 256 x 256 with 1.56 mm pixel. The PET image slice thickness was 3.75 mm. The CT scans were performed with 120 kV, 400 mA, 0.5 sec tube rotation, and 3.75 mm slice thickness. CT data were used for attenuation correction. The acquired data were corrected for decay and dead time.
Measurements were performed on a cylindrical phantom which is a modified version of the IEC Image Quality Phantom [12] (Figure 1) containing three more spheres for a total of 9 spheres with volumes ranging from 0.14 mL (diameter of 0.6 cm) to 98 mL (diameter of 5.7 cm).
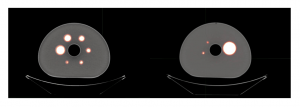
Figure 1. Sections of the IEC Image Quality Phantom.
The phantom simulates a human thorax with lesions of different sizes and activity concentrations. The sphere/background activity ratios (RS/B) ranged from 2 to 73 for a total of 11 phantom sets. For each phantom set PET scans in 3-D list mode were performed with different acquisition times (2, 3, 4, 5 minutes) at the aim to evaluate the influence of the acquisition time on data quantification.
Images were reconstructed with the following parameters [13,14]:
- OSEM algorithms (Ordered-Subset Expectation Maximization) including TOF (Time of Flight) and PSF (Point Spread Function);
- 3 iterations and 18 subsets;
- a z-filter with a full width at half maximum (FWHM) of 4 mm.
Each acquisition was elaborated with three transaxial filters of 4 mm, 6 mm and 8 mm (FWHM) at the aim to evaluate the influence of the filter on data quantification.
A total of 132 datasets were obtained and analysed. Each dataset is identified by the RS/B value, the acquisition time and the z-filter.
Before the phantom experiment a cross calibration between the PET camera and the dose calibrator used to measure the 18F activity was performed with the aim of minimizing the differences in activity measurement between the two systems [15,16].
For each dataset the following physical figures of merit were considered:
- Contouring thresholds to define the actual sphere volumes
- Maximum and medium 18F concentration in each sphere
- SUVmax in the spheres
- Hot Contrast Recovery Coefficients (HCRC)
- Signal to Noise Ratio (SNR)
- Contrast
- Coefficient of Variance (CV) in the background
The contouring thresholds were determined using a segmentation tool (PETVCAR GE Healthcare) based on an adaptive thresholding method where thresholds are defined as a percentage of the maximum activity in the sphere [17]. The sphere volumes were determined applying the threshold value that minimizes the difference between the actual volume and the calculated volume. A linear regression model was used to determine the relationship between contouring thresholds, RS/B, sphere volumes and transaxial filter.
The SUV values were determined by the following formula:
SUV = Actvol (kBq/mL) / Actadmin(MBq)/BW (kg)
where Actvoi is the activity concentration measured in the volume of interest; Actadmin is the total activity in the phantom corrected for the physical decay of 18F and BW is the phantom weight (about 10 kg).
Definition of the Hot Contrast Recovery Coefficients is determinant to evaluate the activity underestimation in small objects due to partial volume effects [18]. The coefficients can be calculated using the following formula [19]:
RC = (Measured mean sphere activity – Measured bkg activity) / (Known sphere activity – Known bkg activity)
SNR, Contrast and CV characterize the image quality and they are influenced by the choice of the image reconstruction parameters and in particular by the value of the transaxial filter.
The parameters were calculated taking into account the following relations [20]:
SNR = [Actmax – background]/SD
Contrast = Actmax /background (mean value)
CV= SD/background (mean value) (%)
where Actmax is the maximum activity concentration value measured in the volume of interest, the background activity is determined as the mean activity in 10 ROIs placed in the background and the SD is the mean SD of these 10 ROIs.
3. Results and discussion
3.1. Study Results
The relationship between the measured thresholds and the sphere volume is linear for volumes up to 10 mL while for smaller volumes the two variables show an exponential dependence. This is due to partial volume effects which are more significant for small volumes [21,22]. The observed trend is similar for all 132 datasets acquired. Figure 2 shows the threshold curves determined with an acquisition of 3 minutes and with a transaxial filter of 6 mm filter.
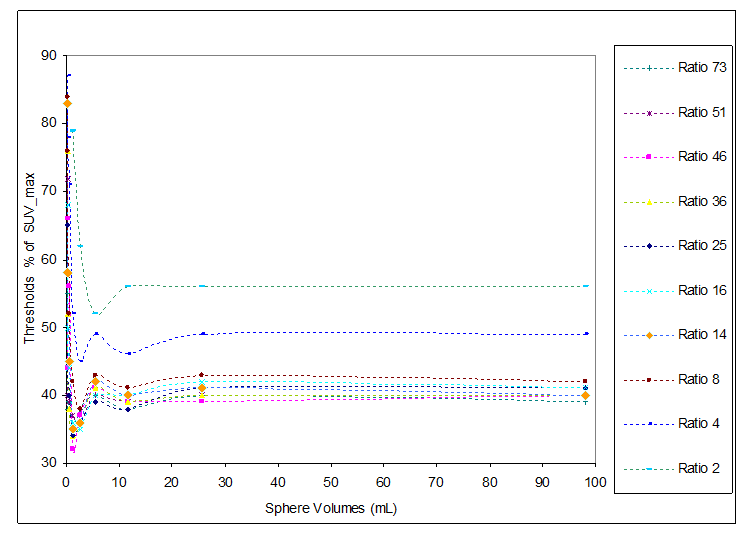
Figure 2. Measured thresholds versus sphere volumes for different background/sphere ratio (acquisition for 3 minutes and 6 mm transaxial filter).
The range of threshold values is between 30% ÷ 87%, with the lowest values for high RS/B (RS/B = 73) and the highest values for low RS/B (RS/B = 2). Different threshold trends were observed for volumes higher than 5.5 mL and volumes lower than 5.5 mL.
For volumes up to 5.5 mL the threshold values are included in the range of 37% ÷ 42% for RS/B between 70 and 8. In case of lower RS/B (< 8) threshold values increase up to 56%. For volumes lower than 5.5 mL the threshold trend changes completely: a minimum value is observed for volume of 1.1 mL and RS/B in the range 8 ÷ 73; this minimum shifts towards volumes of 5.5 mL for RS/B lower than 8. In case of very small volumes (< 1.1 mL) a strong increase in threshold values is observed for all RS/B.
Figure 3 shows the threshold trends as a function of the transaxial filter (4 mm, 6 mm, 8 mm) with fixed acquisition time of 3 minutes. The threshold values depend on the filter used on the image reconstruction, for a 8 mm-filter the threshold values increase of about 10% respect to an image reconstruction using a 4 mm-filter. This dependence is similar for all RS/B and acquisition times.
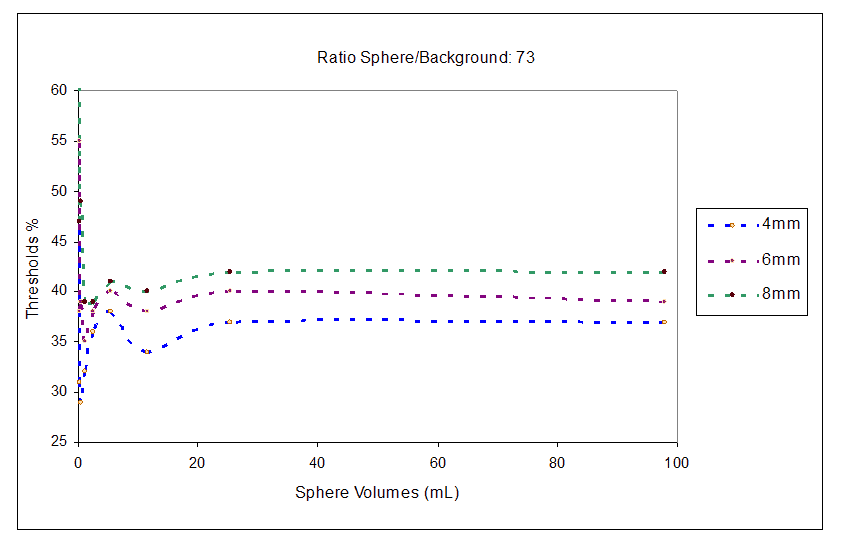
Figure 3. Threshold trend for image reconstruction with transaxial filter of 4 mm, 6 mm, 8 mm and RS/B 73.
No dependence on the acquisition time was observed for threshold values except for the case of 2 minutes where the low acquisition statistics causes a decrease of about 2% in threshold values. Therefore a 3 minutes acquisition time is sufficient to acquire an image with enough statistics to evaluate the patient data correctly.
The trend for volumes ≥ 5.5 mL was fitted with a linear regression model to define the equation relating thresholds, sphere volumes, RS/B and the transaxial filter. From the fit the relationship between these quantities can be expressed as follows:
Threshold % = A / RS/B + B1 . FWHM filter + B2 . Sphere volume + B0 (1)
with A = 47.2 ± 5, B1 = 1.78 ± 0.2, B2 = 0.014 ± 2.1·10-3, B0 =23 ± 3
For volumes between 2.5 mL and 5.5 mL the same equation was used to define contouring thresholds with an estimated error of ± 7% on the threshold values. For volumes < 2.5 mL partial volume effects severely affect activity quantification as shown in literature [23] therefore PET image segmentation using thresholding methods is not recommended since it can produces unreliable results.
Relation (1) can be used to delineate the tumour volumes (> 2.5 mL) in clinical cases taking into account the signal to background ratio of the lesions.
SUV quantification was evaluated considering for each dataset the maximum SUV value (SUVmax) and the percentage error on SUVmax respect to the true value. Figure 4 shows the SUVmax values for each RS/B.
For all ratio RS/B, the SUV is quantified for volumes up to 2.5 mL with an error of about -10%. For smaller volumes the tomograph underestimates the SUV values with an error of about -35% for 0.5 mL up to -80% for very small volumes (0.14 mL). Since the maximum SUV value is a parameter used in clinical assessment to define the pathologic relevance of a lesion, for a correct quantification of SUV the Hot Contrast Recovery Coefficients to be applied to obtain the actual SUV values were measured.
As it is known partial volume effects influence the activity quantification in small lesions and therefore the SUV values. This is related to the scanner resolution. Each PET scanner has an intrinsic point spread function which is a profile of a point source in air. The width of this PSF is a measure of the spatial resolution of the scanner. For objects greater than two times the spatial resolution partial volume effects are negligible. If the objects are smaller than two times the spatial resolution a significant fraction of counts spills out of the reconstructed object.
This can result in an underestimation of activity concentrations and overestimation of the object size. To compensate for the decrease in measured activity the recovery coefficients for hot spheres has to be calculated as a function of the object size. Table 1. Shows the HCRC measured for all RS/B. Recovery coefficients range from 87% to 16% as the diameter of the spheres decreased.
Table 1. Hot Contrast Recovery Coefficients (HCRC) for different ratio RS/B.
SNR, Contrast and CV analysis are shown in Table 2. The higher value of SNR is obtained with filter of 8 mm. The Contrast and CV decrease when increasing the filter width.
Table 2. SNR, Contrast and CV versus FWHM transaxial filter (4 mm, 6 mm, 8 mm).
3.2. Discussion
Since in our Institute PET images are used to identify the Radiotherapy target volume and SUV values are used to classify the malignant grade of a lesion, aim of this study was to investigate the performance of our PET scanner in terms of SUV quantification and validate a PET segmentation method based on adaptive threshold algorithms.
The study was performed using a cylindrical phantom containing hot spheres in a warm background. Different tumour/background ratio (RS/B) were used to simulate concentrations of 18F similar to those observed in clinical cases. The RS/B range between 2 to 73, each phantom was acquired for different times (2 min, 3 min, 4 min, 5 min), the data were then elaborated including TOF and PSF algorithms and different transaxial filters (4 mm, 6 mm, 8 mm) to analyse the influence of the filter on data quantification. For each dataset the sphere volumes were determined applying adaptive thresholds calculated as a percentage of the maximum activity concentration in the spheres. For all ratios RS/B the measured thresholds are linear for volumes ≥ 5.5 mL (sphere diameter of 22 mm).
For volumes between 2.5 mL and 5.5 mL the linear trend is no more valid; in this interval thresholds decrease reaching a minimum for sphere volumes of 1.1 mL (diameter 13 mm). For volumes <1.1 mL thresholds increase exponentially because of partial volume effects. Thresholds vary in the range 30% ÷ 87% with lower values for high RS/B (73) and higher values for low RS/B (2).
The measured thresholds present a dependence on the transaxial filter used in the image reconstruction, increasing the filter value it is necessary to increase the threshold contouring a fixed sphere volume. Thresholds do not depend on the acquisition time; 3 minutes acquisition time are enough to reach a good statistics for data analysis. The trend of the measured thresholds for volumes above 2.5 m can be described with a linear regression model depending on three parameters: the sphere volumes, the ratio RS/B, the filters applied in the image reconstruction.
For volumes smaller than 2.5 mL the adaptive thresholding method is no more applicable because of partial volume effects therefore PET segmentation of lesions with dimensions < 2.5 mL seems to be inadequate.
SUV quantification was investigated measuring in each dataset the maximum values in the hot spheres and the percentage error on SUVmax respect to the true value. For all ratio RS/B, the SUV is quantified for volumes up to 2.5 mL with an error of about -10% while for lower volumes the tomograph underestimates the SUV values with differences of -34% for 1.1 mL up to -80% for very small volumes (0.14 mL). This underestimation of SUV in small volumes is caused by partial volume effects. Since the SUVmax value is a parameter commonly used to identify the malignance of a lesion, a quantification of SUV for lesion smaller than 2.5 mL is inadequate without taking into account a compensation of the decreased measured activity in the lesion.
For this reason the Hot Contrast Recovery Coefficients for hot spheres were measured. For each ratio RS/B the underestimation of the mean activity concentration as a function of sphere volumes was calculated. Recovery coefficients range from 87% (for sphere of 0.14 mL) to 16% (for sphere of 98 mL). For each dataset the SNR, CV and Contrast characterizing the PET image quality were also analyzed. These parameters were evaluated as a function of the applied transaxial filter. The higher value of SNR is obtained with a filter of 8 mm. The Contrast and CV decrease with increasing the filter width. From our analysis a filter width of 6 mm seems to be a good compromise to obtain a higher SNR and Contrast and lower CV.
4. Conclusions
The present study highlights that PET data quantification in terms of SUV can be strongly influenced by the limited PET resolution. From the clinical point of view this means that very small lesions (<2.5 mL) with low measured SUVmax (< 2g/mL) might represent a false negative. Moreover the limited intrinsic PET resolution and the choice of the image reconstruction parameters influence lesion segmentation of PET images. The adaptive thresholding method based on RS/B used in this study may be an useful tool for tumour boundary definition but, as demonstrated, it may provide unreliable results for volumes less than 2.5 mL.
Conflict of interest
The authors confirm that this article content has no conflict of interest.
References
Key References: 3, 7, 8, 15, 18
- Gambhir SS, Czernin J, Schwimmer J, et al. A tabulated summary of the FDG-PET literature. J Nucl Med. 2001; 42: 1S–93S. [PubMed Abstract]
- Nestle U, Weber W, Hentschel M, Grosu AL. Biological imaging in radiation therapy: role of positron emission tomography. Phys Med Biol. 2009; 54: R1-25.[CrossRef] [PubMed Abstract]
- MacManus M, Nestle U, Rosenzweig KE, et al. Use of PET and PET/CT for Radiation Therapy Planning: IAEA expert report 2006-2007. Radiother and Oncol. 2009; 91: 85-94. [CrossRef] [PubMed Abstract]
- Price PM, Green MM. Positron emission tomography (PET) imaging approaches for external beam radiation therapies: current status and future developments. Br J of Radiol. 2011; 84: S19-S34. [PubMed Abstract]
- Troost EG, Schinagl DA, Bussink J, et al. Innovations in radiotherapy planning of head and neck cancers: role of PET. J Nucl Med. 2010; 51: 66-76. [CrossRef] [PubMed Abstract]
- Schinagl DA, Hoffmann AL, Vogel WV, et al. Can FDG-PET assist in radiotherapy target volume definition of metastatic lymph nodes in head-and-neck cancer? Radiother and Oncol. 2009; 91: 95-100. [CrossRef] [PubMed Abstract]
- Bai B, Bading J, Conti PS. Tumor Quantification in Clinical Positron Emission Tomography. Theranostics. 2013; 3(10): 787-801. [CrossRef] [PubMed Abstract]
- Erdi YE, Mawlawi O, Larson SM, et al. Segmentation of lung lesion volume by adaptive Positron Emission Tomography Image thresholding. Cancer. 1997; 80(12 Suppl.): 2505-2509. [CrossRef] [PubMed Abstract]
- Daisne JF, Sibomana M, Bol A, et al. Tridimensional automatic segmentation of PET volumes based on measured source-to-background ratios: influence of reconstruction algorithms. Radiother and Oncol. 2003; 69(3): 247-250. [PubMed Abstract]
- Geets X, Lee JA, Bol A, et al. A gradient-based method for segmentating FDG-PET images: methodology and validation. Eur J Nucl Med Mol Imaging. 2007; 34(9): 1427-1438. [CrossRef] [PubMed Abstract]
- Bettinardi V, Presotto L, Rapisarda E, et al. Physical performance of the new hybrid PET/CT Discovery-690. Med Phys. 2011; 38(10): 5394-5411. [CrossRef] [PubMed Abstract]
- Nema IEC Body Phantom Set™. Data Spectrum Corporation. [Reference Source]
- Rapisarda E, Bettinardi V, Thielemans K, Gilardi MC. Image-based point spread function implementation in a fully 3D OSEM reconstruction algorithm for PET. Phys Med Biol. 2010; 55(14): 4131-4151. [CrossRef] [PubMed Abstract]
- Alessio AM, Stearns CW, Tong S, et al. Application and evaluation of a measured spatially variant system model for PET image reconstruction. IEEE Trans Med Imaging. 2010; 29(3): 938-949. [CrossRef] [PubMed Abstract]
- Boellaard R, O’Doherty MJ, Weber WA, et al. FDG PET and PET/CT: EANM procedure guidelines for tumour PET imaging: version 1.0. Eur J Nucl Med Mol Imaging. 2010; 37(1): 181-200. [PubMed Abstract]
- Vriens D, Visser EP, de Geus-Oei LF, Oyen WJ. Methodological considerations in quantification of oncological FDG PET studies. Eur J Nucl Med Mol Imaging. 2010; 37(7): 1408-1425. [CrossRef] [PubMed Abstract]
- PETVCAR GE User Guide. Ge Healthcare 2011. [Reference Source]
- Erlandsson K, Buvat I, Pretorius PH, et al. A review of partial volume correction techniques for emission tomography and their applications in neurology, cardiology and oncology. Phys Med Biol. 2012; 57(21): R119-159. [CrossRef] [PubMed Abstract]
- Habib Zaidi. Quantitative Analysis in Nuclear Medicine Imaging. New York, NY: Springler-Verlag; 2006. [Reference Source]
- Akamatsu G, Ishikawa K, Mitsumoto K, et al. Improvement in PET/CT Image Quality with a Combination of Point-Spread Function and Time-of-Flight in Relation to Reconstruction Parameters. J Nucl Med. 2012; 53(11): 1716-1722. [CrossRef] [PubMed Abstract]
- Kessler RM, Ellis JR, Eden M. Analysis of emission tomographic scan data: limitations imposed by resolution and background. J Comput Assist Tomogr. 1984; 8(3): 514-522. [CrossRef] [PubMed Abstract]
- Hoffman EJ, Huang SC, Phelps ME. Quantitation in positron emission computed tomography: effect of the object size. J Comput Assist Tomogr. 1979; 3(3): 299-308.[CrossRef] [PubMed Abstract]
- Soret M, Bacharach SL, Buvat I. Partial volume effect in PET tumor imaging. J Nucl Med. 2007; 48(6): 932-945. [CrossRef] [PubMed Abstract]
Article information
Corresponding author: Ornella Ferrando.
Copyright: © 2015 Ferrando O et al.
How to cite: Ferrando O, Foppiano F, Scolaro T, Gaeta C, Ciarmiello A. PET/CT images quantification for diagnostics and radiotherapy applications. J. Diagn. Imag. Therapy. 2015; 2(1): 18-29 (https://dx.doi.org/10.17229/jdit.2015-0216-013).
Article history: Received 06 February 2015; Revised 15 February 2015; Accepted 16 February 2015; Published online 16 February 2015.
Archive link: JDIT-2015-0216-013
home »